
All Episodes (click link to navigate)
New CQC Inspection Framework?Care Homes - If we carry on like this where will we be in 10 years’ time?
Why are we so unfair to care homes that require improvement?
£4 billion spent on Inadequate homes?
Where Are You Going To Build?
Nearly half of all care home closures in the first six months of 2022 had a Good rating
What is the value of a CQC Rating?
A Local Authority Lottery
7 Years
Where is Outstanding? 2021 Update
CSI investigates the CQC COVID-19 Insight into care home deaths
Keeping a close eye on the care home transfer market
Where is Outstanding?
Covid impact on the care home market
Shutting The Door After CQC has Bolted October Update
Shutting The Door After CQC has Bolted
What is the Future of Social Care
Staying Alive
New CQC Inspection Framework?
How CQC inspections are undertaken is changingWill where inspections are undertaken change as well?
And will the number of inspections increase?
For a number of years the CQC has prioritized failing care homes when selecting where to inspect rather than a more regular frequency for all homes.
In their latest quality of Care publication the CQC state that “During 2022/23, we continued to take a risk-based approach to inspections, focusing our activity on those core services we know that, nationally, are operating with an increased level of risk, and on individual providers where our monitoring identifies safety concerns.”
However, as Chart 1 shows, the capacity for inspection is such that it means that the average age of the latest published report for care homes at the start of 2024 was around 2 years 10 months. The higher the rating the greater the age – Good ratings averaged 3 years 3 months and Outstanding over 4 years.
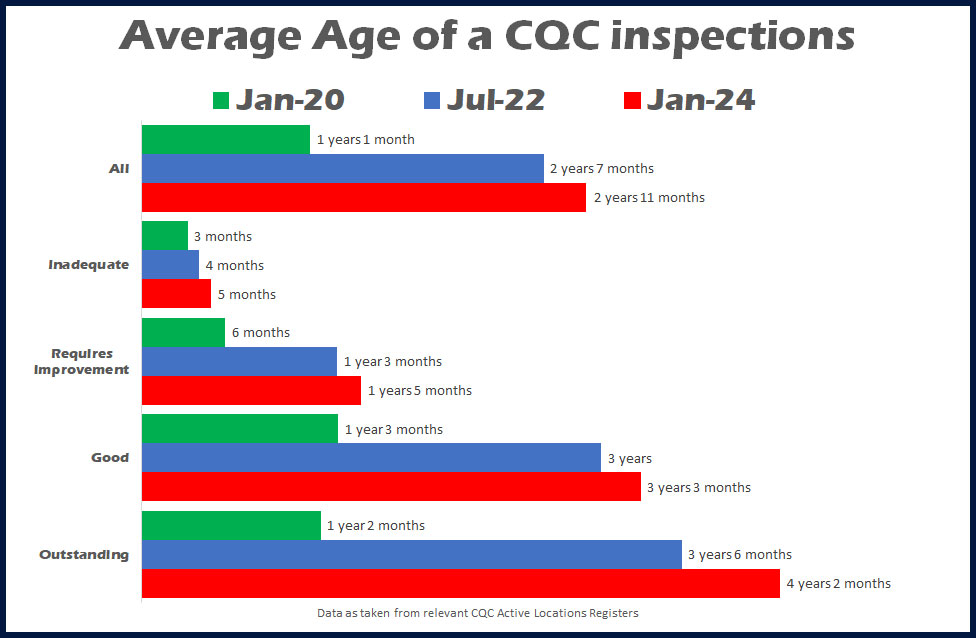
It is true that COVID meant that there were no or a vastly reduced number of inspections, although according to research CSI undertook and published in July 2022, the pre COVID average age was 2 years 7 months, just 3 months younger than today.
The new framework which started in the South region in November 2023 will be gradually rolled out in 2024, with a review at the end of June 2024.
Chart 2 compares the overall ratings of all care homes for older people with both the previous ratings of care homes inspected in 2023, and the results after the inspections.
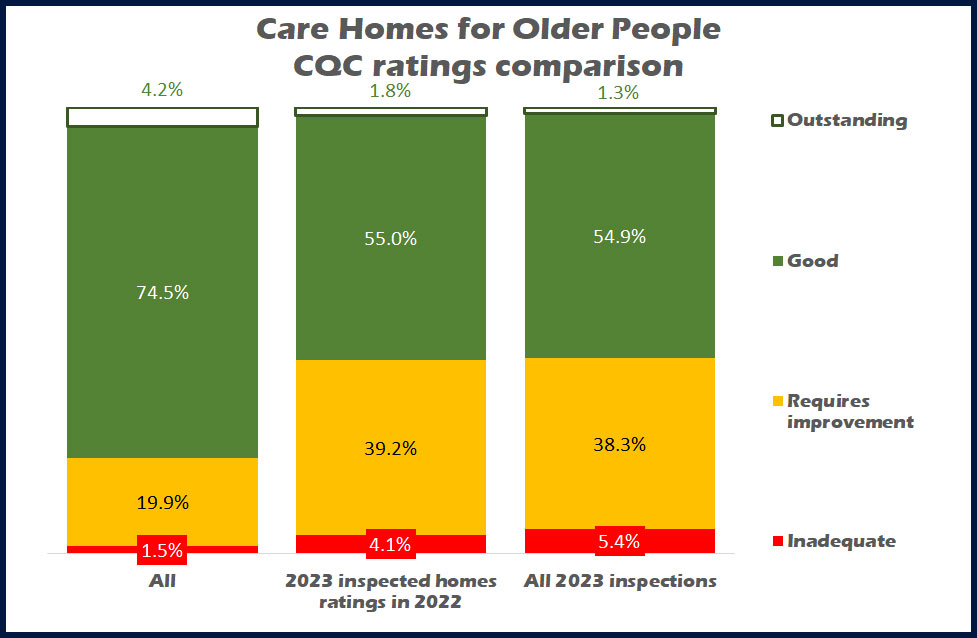
What is clear to see that the rating profile of those homes with a 2023 published inspection was much lower than the whole population of care homes.
Whilst around 75% of all care homes have a Good rating only 55% of homes that were selected for a 2023 inspection had this rating. Around twice the relative share of Requires Improvement homes were selected and nearly three times as many Inadequates.
In fact in addition to the 64 care homes given an Inadequate rating in 2023, another 49 had the same but didn’t make it to the end of 2023 and closed. And those 49 Inadequate ratings accounted for 75% of all care homes that were inspected and closed in 2023.
Now one can understand the need to address locations where the risk of poor care is higher, this has always been a CQC objective.
But what effect did those inspections have? Outstanding ratings reduced, about the same percentage came away with a Good rating, there was a nominal reduction with Requires Improvement, and an increase in Inadequates.
So in effect what we have is the CQC focusing on the lower rated care home, and those ratings getting even lower.
In reality the new framework and whatever it is designed to achieve must include an increase in the number of inspections undertaken to reduce the average age and give the public and professionals such as commissioners more confidence in the relevance of a rating as old as it is.
In 2023 around 2,300 or 25% of care homes for older people received an inspection, so this means that a four-year turnaround of all homes is all we can expect. At this rate the average age of inspections will continue to grow rather than shrink.
But of course care homes may well be content with the fact that as long as they can provide good quality care they will not be troubled by the CQC for a number of years.
And will testing a new framework whilst the old one is still in practice slow down progress rather than speed it up?
And how will the inspection ratings from the old and new framework be compared?
All in all not a promising situation for CQC inspections, new framework or old.
Back To Top
Care Homes - If we carry on like this where will we be in 10 years’ time?
CSI Marketing Intelligence recently published a report that shows a worrying trend with care home closures that are double that of openings, with lost beds causing the displacement of thousands of vulnerable residents.Here I look at what has happened in recent years, and what will happen if the trend continues over the next ten years.
My company has been publishing its annual Say Hello Wave Goodbye report since 2015. The report looks at openings and closures within the care home for older people market in England and following a poor performance in 2022 we took a further look at the first six months of 2023. In compiling the data, we were mindful that the 2022 report showed the lowest number of openings for seven years and was around 23% down year on year. Additionally, there was a net deficit of 230 beds against a slight growth in beds that was achieved in the previous two years.
The “half time report” for 2023 was hopefully going to report a much-needed year on year increase against the same period in 2022 but alas this is not the case. Openings were the same and closures were slightly down, but due to a higher average size of those homes that closed there was a net loss (i.e., beds gained through openings minus those lost through closures) of over 1,300 beds against 400 in the first six months of 2022.
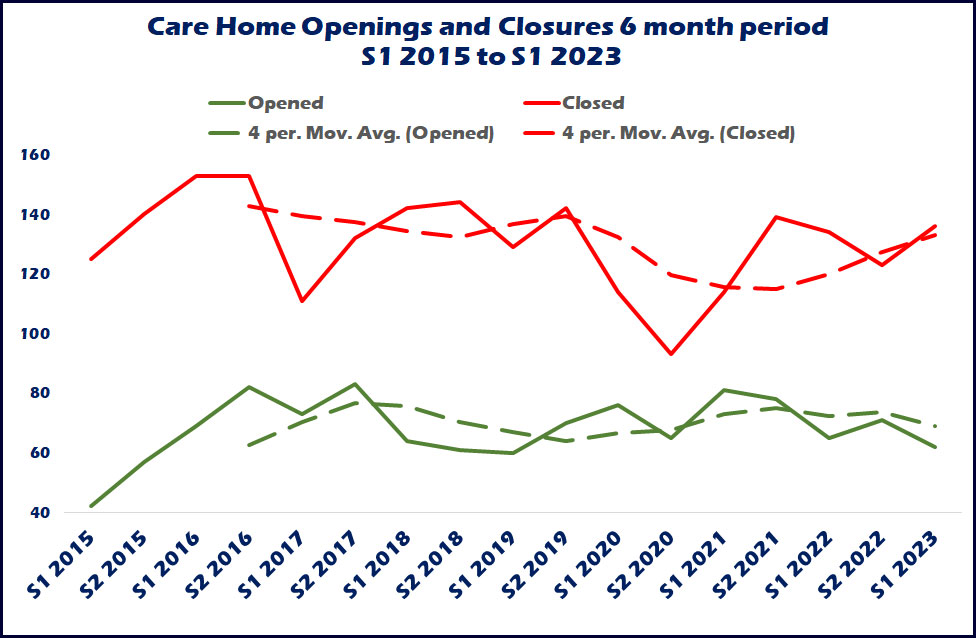
Chart 1 shows openings and closures for every six-month period since the beginning of 2015, with openings at around 60 to 80 every six months and closures roughly between 120 and 140, so it seems to be a rule of thumb that closures continue to outstrip openings by two to one, and this is something the sector really needs to eradicate if we are to obtain any growth in the market. More importantly taking an average over the previous two years the latest trend shows an increase in the number of closures and a decrease in openings.
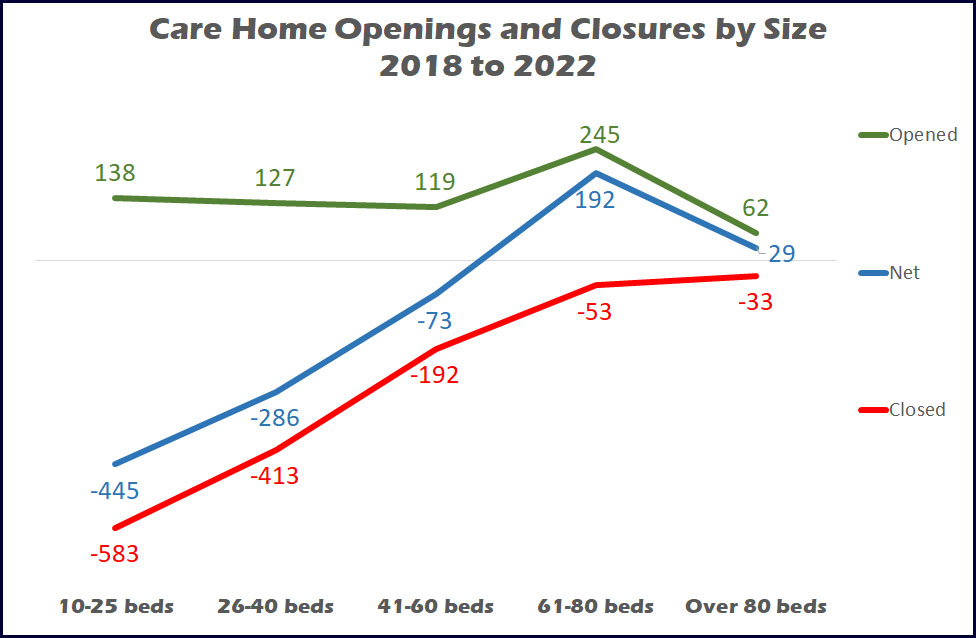
The homes that close are generally smaller than those that open averaging around 30 beds and 50 beds respectively, and this somewhat reduces the impact of lost beds. Chart 2 shows the number of openings and closures by size of home between January 2018 and the end of 2022, with openings predominantly in the 61-to-80 bed sector, closures in the 10-to-40 bed sector.
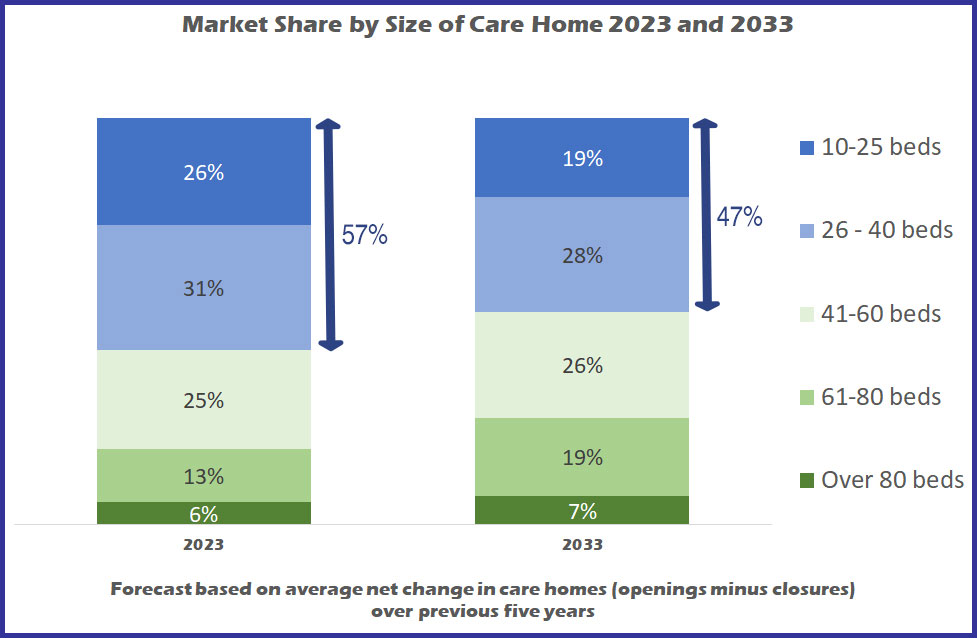
However due to the relatively low levels of openings (adding less than 1.5% to the market every year), if this continues there is not going to be a massive swing in the shape of the marketplace towards larger homes even over the next ten years. Chart 3 shows that based on average openings and closures over the past five years, homes with 40 beds or less will still account for 47% of the market in 2033, compared with 57% currently, and the only real growth will be in the 61-to-80 bed sector growing from one in eight homes to one in five by 2033.
Dementia the driving force for openings
Dementia is basically the driving force of care home openings, although the sectors do also suffer the greatest losses, as the sector has a 74% market share.Normally nursing dementia is the only one of the four sectors to show a net growth in both homes and beds every year, and so is the only sector to show any real growth over the next 10 years, with nominal growth in residential dementia.
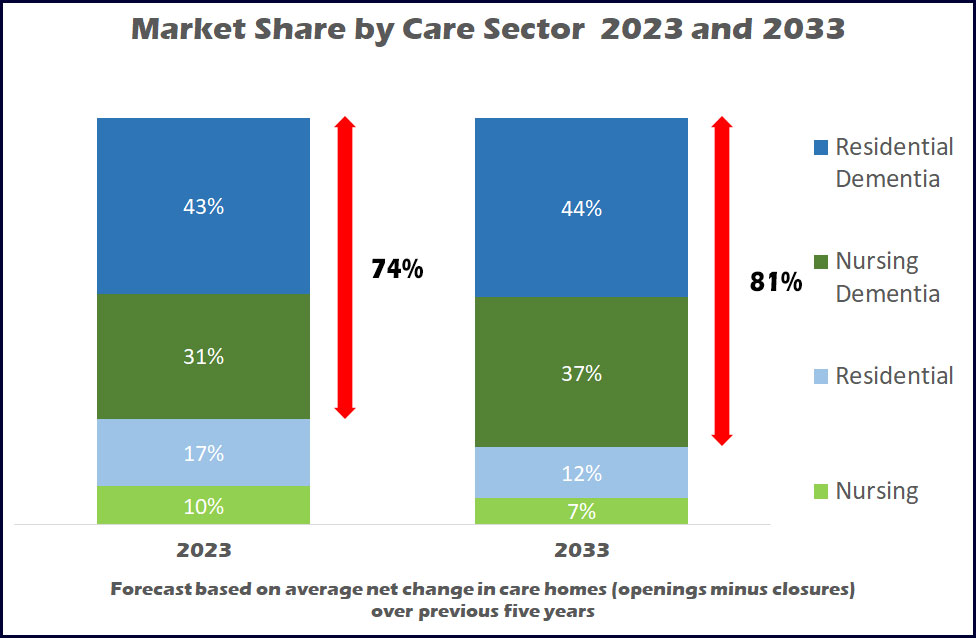
Chart 4 shows that on recent trends nursing dementia will grow from a 31% share of homes to 37% in 2033, and a nominal 1% growth for residential dementia will mean that the total dementia sector will grow from 74% to 81% over the next 10 years.
Measuring beds rather than homes
So that is a look into the future for care homes in England, but of course beds rather than homes that are key to providing care, and from our heritage of reporting on the sector, there are some worrying facts.
Care homes with a total registration of nearly 70,000 beds have closed between the beginning of 2015 and the middle of 2023, with the resulting displacement of vulnerable older people.
Whilst average occupancy has teetered between 75% and 90%, even if one assumes that the homes had lower levels of residency as an indicator of a reason for closure, this still means that probably around 40,000 people have had to give up their homes, their care home friends, and be moved to another location with the obviously negative impact it will have had on their life, especially those living with dementia. This, if nothing else, is a key reason to support the care home sector and stem the flow of closures.
But I hear you say, “we need new stock, many homes are not fit for purpose”. This may be true, but I have already shown that new stock is not arriving quick enough, and even if it was it would not prevent the displacement issue.
Overall availability of beds on a local basis is also a key issue. Whilst I have provided national statistics, the provision of care is a local service. Supply levels across the country vary greatly and it is not always that care homes close in an area of high supply nor is it that new homes are built in areas of low supply.
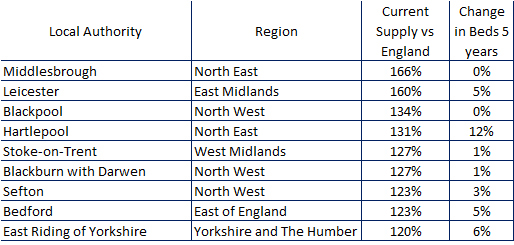
For example, there are nine local authorities that have supply levels between 20% and 66% above the national average supply levels (based on number of beds for every thousand local population aged 75 and over) and of these seven have shown an increase in beds over the last five years, the other two showing no change.
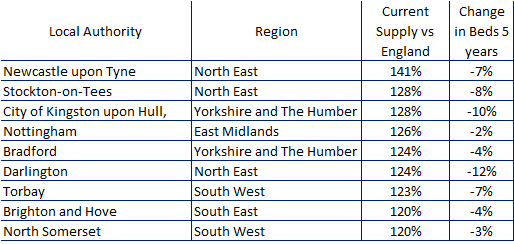
And of seven local authorities with between 20% and 30% below average supply levels, six have lost further beds over the last five years. The situation is even worse in London where supply levels are even lower and decreasing by the year.
CSI provides a MIDAS report for its clients, mapping out the local supply and demand levels around any location in England, and I can safely say that no two reports are the same. The reports are commissioned for providers wishing to either buy an existing home or build a new one, with as many of them moving away from the initiative due to high competition levels, as those that rub their hands together with joy at the opportunity that the location offers.
This has been the same throughout our history providing the reports and does not look as if it will change. How extensions have helped the availability of care home beds
Whilst care home closures have outnumbered openings the older age population has of course increased greatly.
According to Government ONS data the 75 plus population stood at around 4.5 million in 2015 and grew to 5.4 million in 2023, an increase of more than 20%.
This has meant that the number of beds available for this population has reduced from around 89 per thousand in 2015 to 74 per thousand this year, a reduction of 17%.
So, if we have been losing more beds from closures than we have gained from openings why is the decrease in supply levels less than the population growth?
Extensions
There are over 6,000 care homes from 2015 who are still trading under their original CQC registration and of these around 1,000 have added a total of 7,250 beds to their registration. There have also been around 600 sales of homes to new owners some of whom would also have added to the registrations at the point of purchase, and so have between them all have increased by around 2,000 the number of beds currently available against 2015.
This still means that current availability of beds is still around 17% lower than it was eight years ago and will continue to reduce on current trends. ONS continues to forecast a further 20% growth in the 75 plus population by 2033 and if current opening and closure trends continue, without further extensions at the level we have seen over recent years, beds per thousand will drop to around 60, one third below that of 2015.
One possible saving grace, for the population if not the care home sector, is the hope that research into dementia treatment will be developed so that the disease is slowed if not eradicated, and the need for a person living with dementia to enter a care home will reduce.
Back To Top
Why are we so unfair to care homes that require improvement?
Whilst the CQC are planning a (much delayed) new inspection process, adding local authorities to their remit (and considering strike action) they still have a lot to sort out within the current system and ratings that are being put in front of the public and media.COVID created a long gap in inspections that has resulted in the average age of a published rating changing from just over one year to over two and a half years, ageing by 18 months with Good and Outstanding ratings averaging around three years old.In the last couple of weeks I have responded to negative national media towards our care home sector with headlines reading along the lines of “Councils are paying large sums for elderly care homes that are inadequate, need improving and not safe”
In many instances the media include homes rated Requires Improvement in their reports that account for 92% of their “unsafe” sample and this is unfair when one considers what it takes for a home to fall one level below the Good rating.
In 2022 pro rata two and a quarter the number of homes closed with a Requires Improvement rating to those rated Good. Now one might well say that is fair enough if it’s down to care quality, but we are not talking about an Inadequate rating – far from it.
Around one in five care homes are rated Requires Improvement and nearly half of them have more Good ratings across the five measurements - Safe, Effective, Caring, Responsive and Well Led - than they do Requires Improvement.
Only 10% of homes rated as Requires Improvement are rated this way across all five measurements.
And there are care homes out there that have been given a Requires Improvement rating when their scores across the five measurements are THE SAME as a home rated as Good as the graphic below shows.
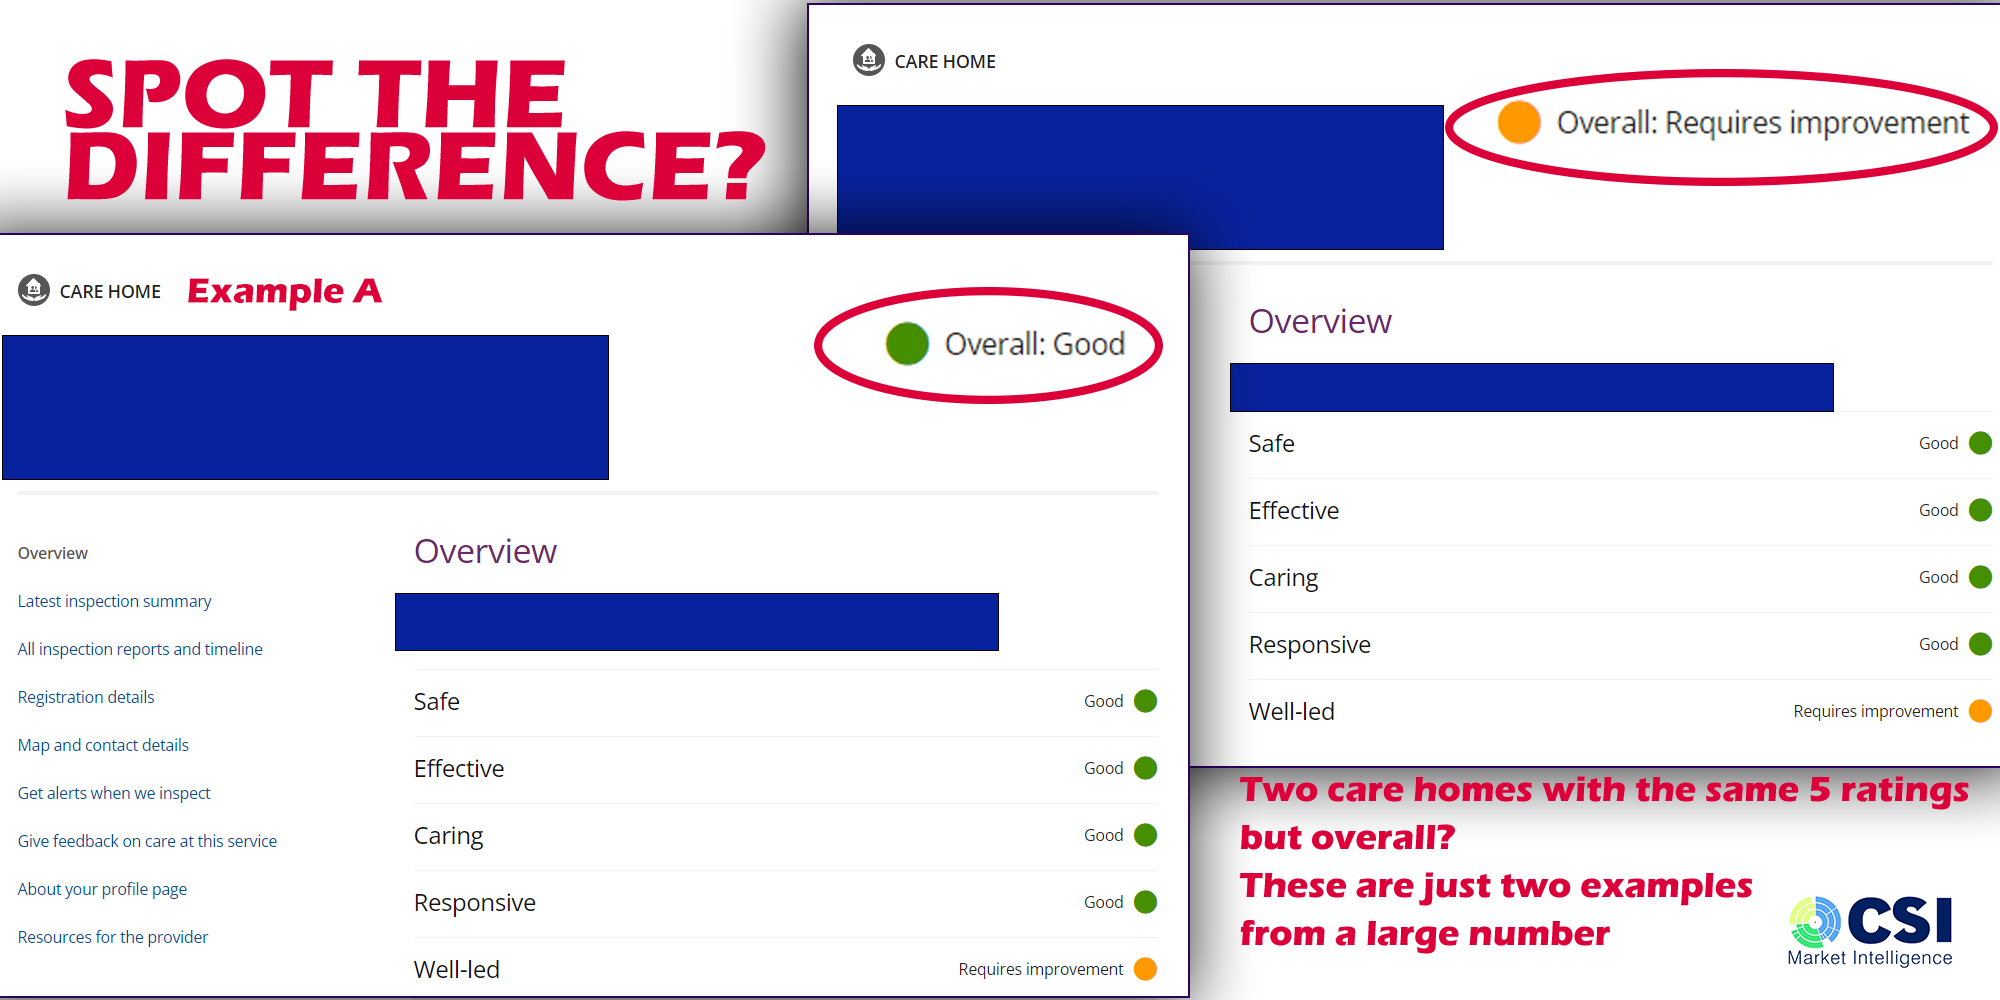
The image is extracted from a relevant care home page on the current CQC website, with the overall ratings enlarged and highlighted for easier viewing.
The examples are not restricted to a single time frame, nor a localized problem.
Both sets of ratings include ones given this year and go back at least to 2019 and seven out of the nine regions have homes in both examples.
And whilst 83% of Good care homes are rated Good across all five the other 17% have at least one Requires Improvement rating within their overall inspections results.
So there is a fine line between a care home rated across these two levels and yet there is a massive distinction in the way they are regarded by the media, and the public, affecting both occupancy and recruitment opportunities, and their propensity to closure and their treatment as unsafe by the media
Back To Top
£4 billion spent on Inadequate homes?
Once again I have found myself questioning the validity of mainstream reporting of care homes, over the last week in The Guardian.The first I refer to is The Guardian’s editorial from Saturday 25th March that stated “Five care chains MAKE £150m a year for low-rated homes in England”
The report says that between them Barchester Healthcare, BUPA Group, Four Seasons, HC-One Limited and Runwood make £150m from their low rated homes, “some of which are unsafe”.
Now when one talks about MAKING money, it’s normally the profit – wages after tax, income less costs and not income alone – and with the fair cost of care exercise proving that local authorities are not paying enough to cover care home costs – who is actually making money?
Ignoring that semantic I think it unfair that these five groups have been cited, when their CQC ratings are in line with all care homes across the country with more than three out of every four care homes rated Good or Outstanding, and two of them have a higher rating standard.
Additionally, according to the Guardian graphic (you will have to refer to the editorial) only around 10% of their £150 million are for Inadequate homes, the vast majority refers to homes with a Requires Improvement rating.
And if it is that HC-One were paid £10m for inadequate beds (same graphic) then CSI estimates that local authorities are paying the group around £1,100 per week – and that assumes the beds are full for 52 weeks in a year. And there are not many (any?) care homes that will be Inadequate for a whole year and continue to receive local authority patronage.
And let us put into context that there are only a total of 631 beds in an Inadequate care home run by these five groups. Assuming 80% of these beds are occupied (an optimistic figure for an Inadequate home) and that only around 63% of beds are local authority funded we are talking about around 300 beds out of over 406,000 available across the country – that’s only 0.07%.
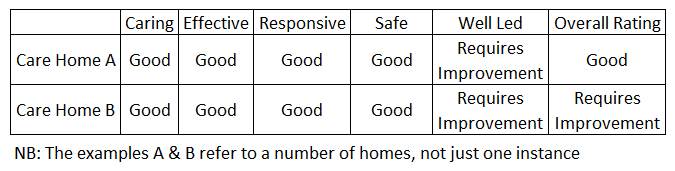
With 90% of the funding in this report referring to homes with a Requires Improvement rating, those in the sector are aware that it is a fine line between a Good rating and being demoted to the one below.
The table below shows that the same ratings for the five different measures do not necessary bring the same Overall result.
And then I discovered that I had missed a Thursday (23rd March) rant by the same paper with a headline reading "English councils spent £480m on ‘inadequate’ care homes in four years"
If one takes all the beds currently in inadequate homes, assumes an (again optimistic) 80% occupancy level and 63% local authority share, then this number works out at £600 a week per resident if the beds were fully occupied in every Inadequate home for all 208 weeks!
But then it was obvious that none of those care homes would have been Inadequate for a whole 4 years and looking at the content most specific cases talk about last year, 2022
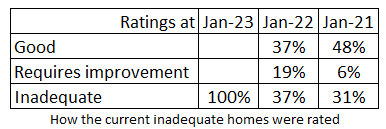
But out of the 180 or so care homes that were inadequate at the end of 2022, one year ago 37% of these same homes were rated Good, the same amount Requires Improvement and only 19% were Inadequate (the rest were not rated) and at the start of 2021 nearly half were rated Good.
And it is very difficult to see how the figures can really look back over 4 years, when 230 Inadequate care homes closed during that period, which is a 27% larger number of homes than those currently rated so. I spoke with one of the authors who said that the research recorded money actually spent over four years, although at the time of writing I could not ascertain whether that was on existing inadequate care homes, or care homes that were inadequate when the money was spent. With ratings changing every month the latter would have been very difficult to record.
In fairness to the editorials they do stress how much the sector is, and has been, underfunded and that much needs to be done to rectify this.
But once again the headlines paint a very negative picture of care home operators and councils.
Back To Top
Where Are You Going To Build That New Care Home?
How an imbalance in local supply levels could mean you are entering a highly competitive marketplace – whereas in other areas you will be happy to find demand currently outstrips supply.Since 2015 CSI Market Intelligence has been monitoring openings and closures within the care home for older people market in England with annual Say Hello Wave Goodbye publications that have, as a rule of thumb, reported that two homes close for every one that opens.
During that time the 75 plus population that accounts for around 90% of care home residents has grown by over 300,000 and yet we have lost a total of 10,000 beds as openings have not been able to keep up with closures.
But this is the national picture – whether or not we see a national social care system in the future to remove in the local imbalance in local authority fees – care has got to be delivered locally and CSI has continually reported that on local basis there is also an imbalance in the number of beds available to the local population.
As an example, whilst nationally there are on average 84 beds per thousand aged 75 and over, at a local authority level this varies from between 26 and 143 beds per thousand – that’s 70% below and 70% above.
Why does the average supply level mean a great deal? Well for years commentators have reported that average occupancies were around 90% - an ideal situation to allow for choice for service users and a relatively decent income level for the provider (although most will aspire to a 100% occupancy and a waiting list.)
Since COVID-19 those occupancy levels have reduced, but nonetheless, how people in need of a bed in the low supplied areas find what they need locally is a mystery, and how providers continue to survive in what must be with low occupancy levels (and an almost impossible task of employing enough staff with all the competition around them.
And whilst that is the situation we currently experience this has not changed much from the where it was in 2015.
In fact some local authorities (LAs) with low supply levels have seen provision shrink even further, whilst developers continue to build in over supplied areas.
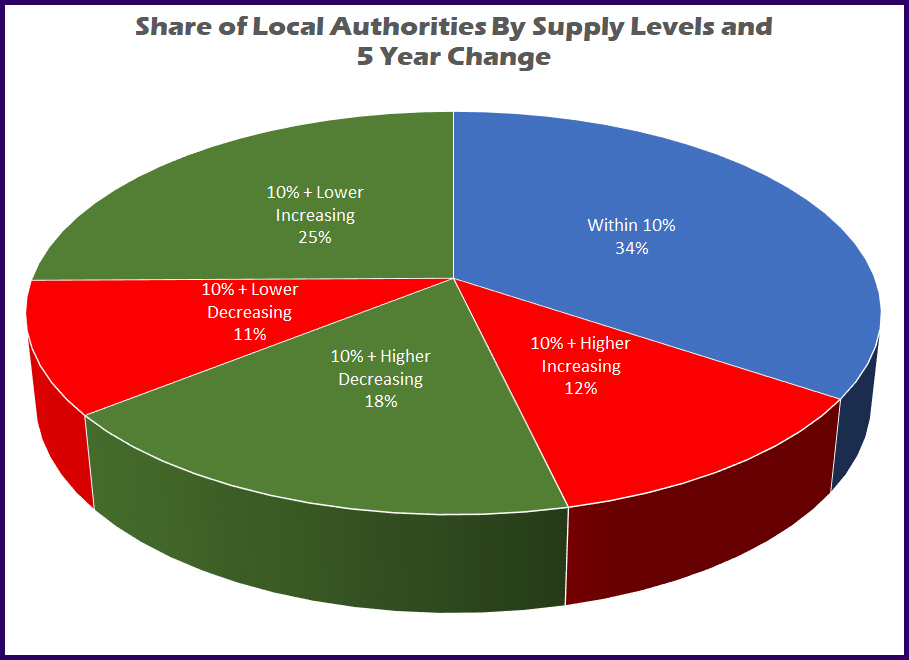
Splitting the Local Authorities into High / Low and Growing Decreasing categories (Pie Chart 1) one can see that around a third are sitting relatively pretty within 10% plus or minus of the average levels, around 25% have either too high a level and are still growing, or too low and shrinking, and the remainder are at least either growing or shrinking closer to the ideal supply level – with varying levels of success.
Over the next few tables we have excluded London as a region as it has its own unique issues that we cover in another investigation.
In each case we look at current supply levels and the percentage change in the number of beds - being the difference between openings and closures, over the last five years, and highlight those LAs that are struggling with too few or too many beds.
The seven LAs in Table 1 have the lowest supply levels and all but one has lost beds since 2017.
A strange mix of small Unitary Authorities from 10 sq miles in area, up to Cornwall and a massive 1,375 square miles. And of course the large authorities will have local highs and lows within their area – which is another issue.
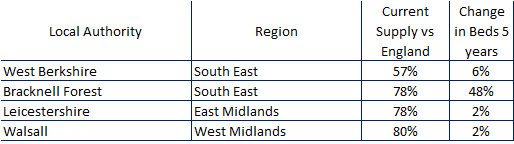
There are some low supplied LAs that are improving (Table 2) but only a handful as seen below and all but one by only a nominal amount, with only Bracknell Forest acquiring much needed beds.
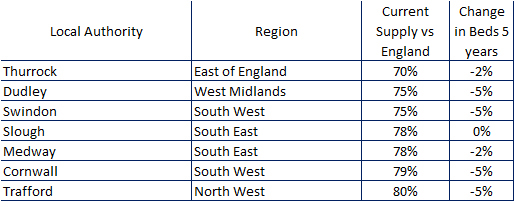
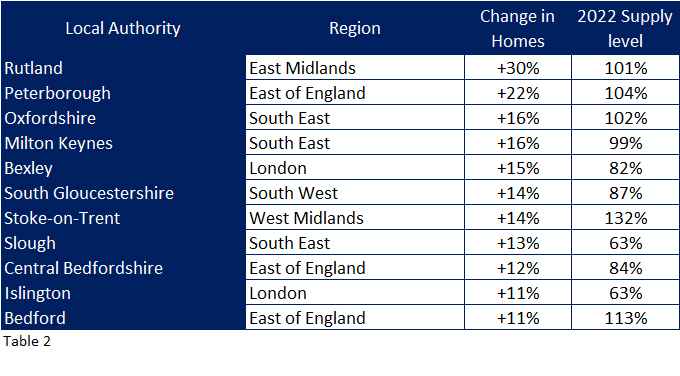
At the highest end of the supply table there are 18 LAS who have supply levels in excess of 20% above the England average.
Of these nine have either stayed level or increased their levels (Table 3)
And nine, probably due to competition issues, have seen the number of beds reduce (Table 4).
The author admits that it is not only about quantity, and quality is also an issue, with many older care homes becoming unfit for purpose. In high supply level areas a new build may push these care homes further out of business – but what about the quality of home where supply levels are too low? This makes a bad situation even worse.
This country is in dire need of new builds in excess of the 100 to 150 care homes that have opened in each of the last five to seven years, but developers really need to try and focus on areas of lower supply.
Perhaps I have given you a few clues about where these areas are in this investigation.
Back To Top
Nearly half of all care home closures in the first six months of 2022 had a Good rating

For the last seven years CSI has kept its eye on openings and closures within the older people sector in England and in investigating the first six months has at least established that closures, averaging about 5 every week, are very much in line with historical closure levels every six months since 2015.
There were 134 care homes closed during this period losing nearly 4,000 beds and the displacement of thousands of residents.
Looking further into the figures we have compared the last six months closures with those between 2015 and the end of 2021, and then against all care homes to see what trends are visible – or in other words which areas have performed better and which ones have not had a good six months.
Regional Closures
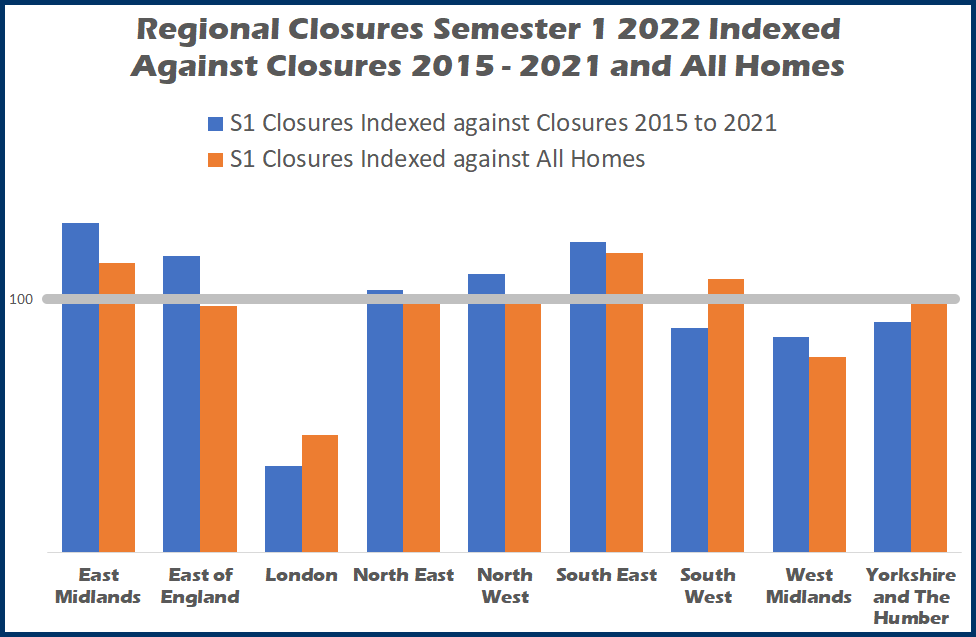
Chart 1 (above) indexes each region’s share of closures in the first six months against the last seven years (blue bars) and then against the total number of care homes (orange bars).
An index of 100 is in line with other measures, and as we are talking closures anything above 100 shows a poorer performance, anything below a relatively better performance.
Compared to closures over the last seven years East Midlands, South East, East of England, and North West have seen an increased share of closures, North East are very much in line whilst South West, West Midlands and Yorkshire and the Humber have performed relatively better.
London shows the best performance with its share of closures in the first six months at around one third of its share of closures over the last seven years.
And moving on to compare London’s share against its share of all care homes the region has also performed the best.
That being said London has by far the lowest supply levels in the country so closures due to competition and therefore struggling occupancy levels will be low, although the region does of course have to deal with the highest costs in the country.
Of the five regions that performed worst in comparison with historical closures, three of them East Midlands, South East, and South West also had a high index of closures compared to their total market shares.
Care Sector Closures
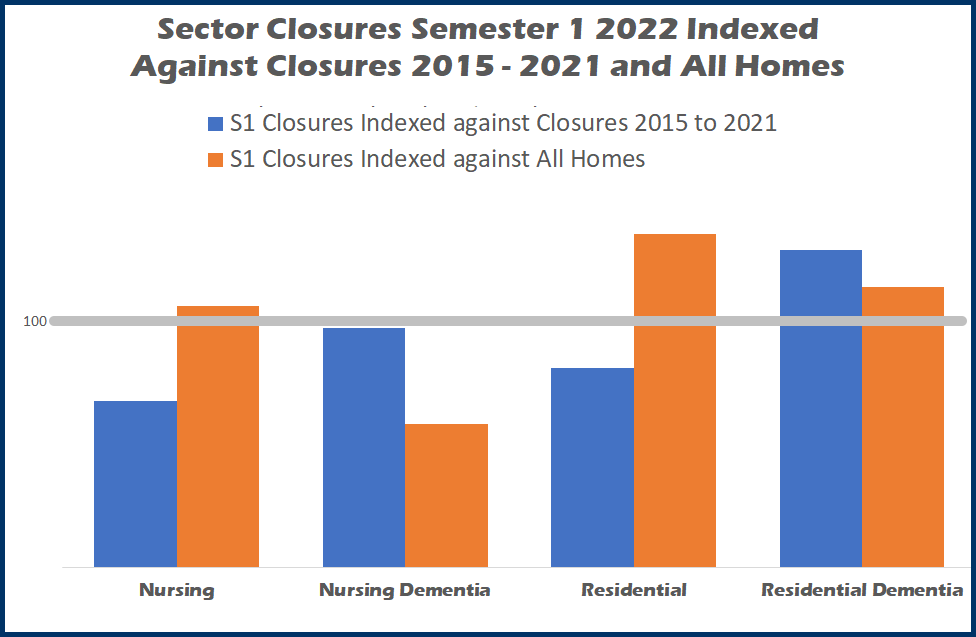
Using the same calculations Chart 2 breaks down closures by the four key care sectors – nursing, nursing dementia, residential and residential dementia.
As can be seen the total nursing sector has proven more resilient than residential.
Nursing (i.e. without dementia) fared well over the first six months in comparison to historical closures, but its share of losses was slightly higher than its total market share.
Nursing dementia preformed the best, with first six months closures very much in line with its share of historical closures and its share of closures is around 40% below its total market share.
Like nursing, residential homes share of closures in the first six months was lower than since 2015, but as a share of its total market share it fares the worst.
Residential dementia had the poorest performance in the first six months of with a share that was around 30% above its share of closures since the beginning of 2015 and around 15% above its market share.
CSI has undertaken many MIDAS reports for its clients, where we measure, amongst other things, supply levels across these four care sectors.
Where a coastal location is involved we have often found that residential dementia has higher supply levels, and therefore have relatively more competition than its nursing counterpart leading to lower occupancy levels.
With this in mind we mapped out residential dementia closure locations (map not shown) and have confirmed that around 45% of first six month closures has involved a care home in a costal location.
CQC Rating a time of closure
CSI has always measured closures by CQC ratings as it gives a good indication for closure.
An inadequate rating says an inability to improve care quality has led to closure, but what of a care home that closes with a Good rating or even Outstanding (yes it happens), this must be down to financial viability rather than the ability to provide quality care, which is of course a tragic situation to lose a care home that is providing good care to its residents, only to have to say goodbye to them.
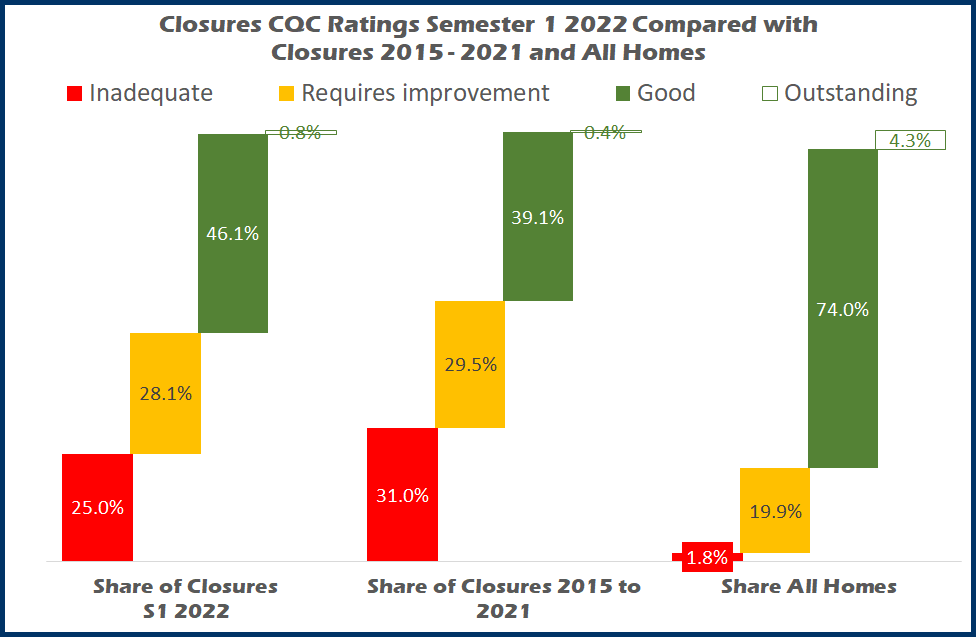
Chart 3 compares the shares of homes closed in the first six months of 2022 against those closed between 2015 and 2021 and all care homes (indexing is not viable as the Inadequate index against all homes is 1373, and therefore creates an unreadable chart)
Whilst Inadequate homes account for just 1.8% of the total they accounted for 25% of closures this year, which is less than 31% of closures since 2015.
Requires Improvement’s shares are a lot closer to each other 28.1% this year, against 29.5% 2015 to 2021 and nearly 20% of all homes.
In the first six months care homes closing with a Good rating accounted for 46.1%, an increase against 39.1% historical closures which shows that commercial rather than care quality pressures are having more of an impact recently. The 46.1% is also getting closer to the 74% share of all care homes.
There was just one Outstanding closure (probably the wrong way to word it) in the first six months of 2022 which was Abbotsbury Residential Home operated by Central Bedfordshire County Council which according to the operators is part of a modernisation programme, although as yet they have not replaced the care home.
Our next investigations will research much needed openings in the first six months of 2022
Back To Top
What is the value of a CQC Rating?

The CQC puts so much weight behind the credence of their 4 rating levels - Outstanding, Good, Requires Improvement, and Inadequate - that are designed to sway decision making by commissioners and families alike on choice of home.
One must be aware if a care home has issues before settling on it as the destination of a loved one, but how can one be confident in care homes in the two higher grades if those grades were attained at an inspection that is a few years old?
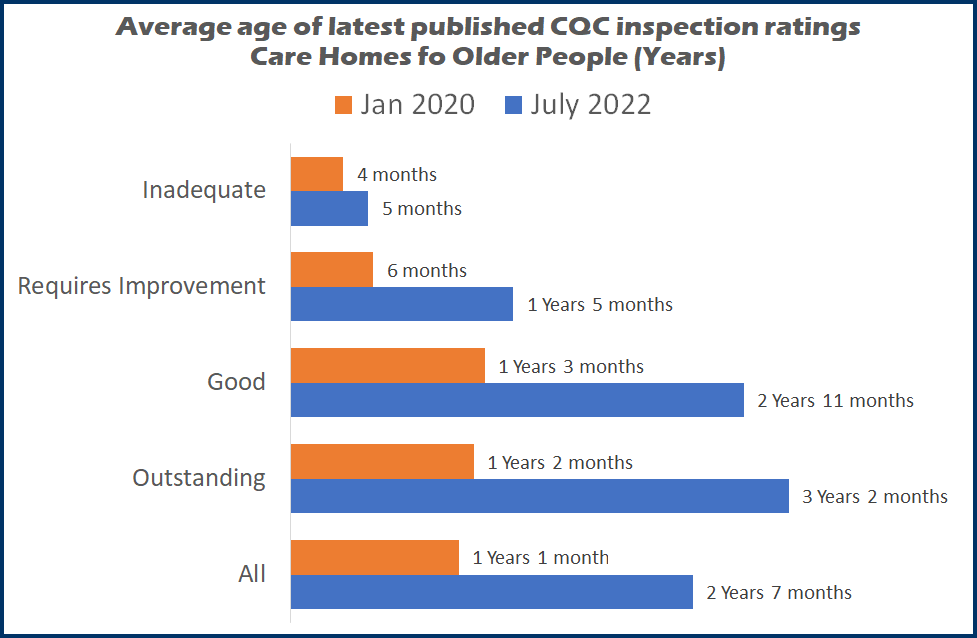
At the start of July this year the average publication date for care homes for older people was a little over two and a half years old.
In fact an Outstanding rating is on average around three years and two months old, a Good rating – of which around three quarters of homes can boast – are two years and eleven months old.
Due to the CQC’s strategy of more frequent inspections of care homes that are in the lower two tiers, Requires Improvement averages one year five months and Inadequates just five months.
Now it is true that COVID interfered with the CQC’s ability to inspect homes and the average age of ratings was much less at the start of 2020 – overall an average of just a little over a year old (see chart 1).
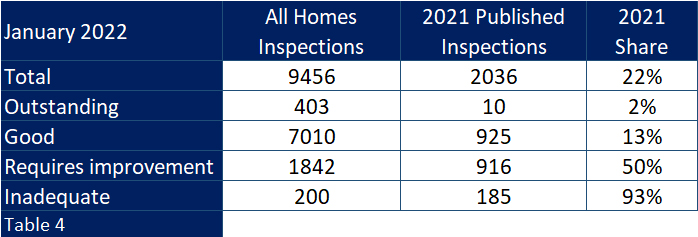
At the start of 2020 there were 5,172 inspections that had publication dates from the previous year, compared to just 2,036 2021 publications at the start of 2022.
So if the CQC can manage that same 5,000 plus level over the next 12 months then they will reach a little over half of all homes, and hopefully start shrinking the average age of inspections.
Unfortunately if you take a look at those that were published in 2019, one of two things is obvious; either the quality of care is reducing or, more likely, the CQC was predominantly inspecting homes where they have concerns.
From the beginning of 2017 up until the end of 2019, CSI-MI was reporting each quarter on how the CQC ratings published that quarter were always well below those already handed out.
Chart 2 taken from the start of 2020 shows exactly this.
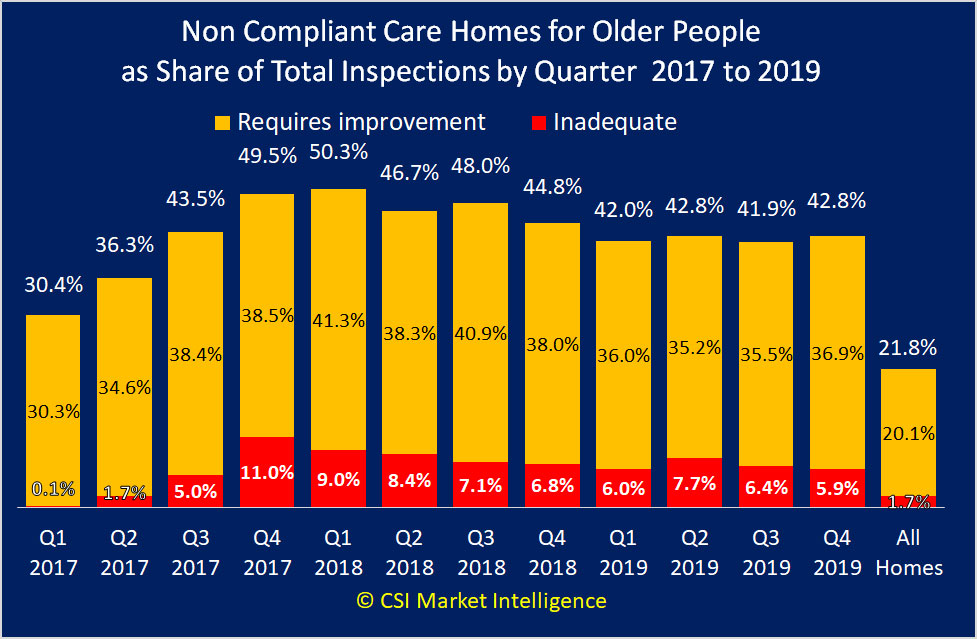
In each of those twelve quarters the share of requires improvements ratings were as high as 50.3% against a total average of just 20.1%. Likewise in one quarter inadequate reached 11% against 1.7%.
And when one looks at how the 2019 inspections fared against the total picture as at 1st January 2020 one can see (table 3) that whilst the inspections accounted for around 58% of all homes, they accounted for above 90% of all those homes carrying a requires improvement or inadequate rating.
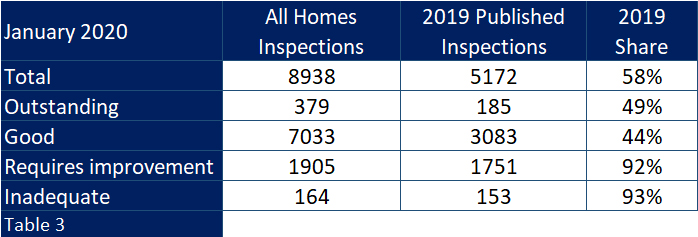
Moving on 2 years and looking back on 2021 inspections with their lower number, the variance between ratings handed out and the total population of ratings is even more disparate (table 4).
And at the beginning of this year of those homes rated Good more than one in three have inspections dated 2018 and before. How can a commissioner or family member place any value in these?
And as one can also see in table 4, only 10 out of 403 “Outstanding” homes can boast a 2021 inspection date.
In their recently published New Quality Statements which the CQC say is “A key part of our future regulatory model is a new single assessment framework. This will form the basis for our assessments of quality in providers, local authorities and integrated care systems.”
But how quickly will they be able to bring the average age of Outstanding and Good inspections down again and inspect enough “compliant” homes to give the new single assessment framework has any relevance.
In February this year CQC stated that “we will inspect where: there is evidence that people are at risk of harm. This applies to all health and social care services, including those where inspections were previously postponed except in cases where we had evidence of risk to life”
If the CQC continues to focus on the lower ranked home, within its new framework it means that the better performing homes will be less likely to be inspected. If they manage the same volume of inspections over the next twelve months as they managed in 2019 but retain the same focus they had in 2021, and assuming they work on oldest first – then they would only have caught up with circa 2,500 Good care homes, all opf which were inspected before the end of 2018.
So what is the point of the CQC introducing a new framework at the moment when it is so far behind in its endeavours with the old one?
Surely it would be better to stay with the existing framework and try and get the average age of all inspections down first. Or will we have to compare “New framework” ratings with “Old framework” ratings for some years to come.
Back To Top
Local Authority Lottery
I have recently contributed to Care Commentary’s ‘Care Sector At A Glance’ page, with an overview of the care home market in England. For the last seven years I have published annual reports on that same market place but in reality, whilst the national picture is interesting, the provision of social care is very much a local thing.
If you are looking for care for yourself or a loved one then you will only be interested in what is available locally – ideally a viable choice of facilities that can provide the correct level of care. And if you are a provider it is only the local marketplace that will impact on your trading performance and the level of competition that will affect both your ability to fill your home with residents and also the availability of local people who are happy to work with you.
But what is local? Every care home is allocated to their host local authority; is this local enough? Well if you’re located in areas such as Slough Unitary Authority, the smallest local authority outside Greater London, then you have just 10 square miles to work in, and that is local. But the largest local authority, East Riding of Yorkshire, is more than 90 times larger, and also has twice as many care home beds per head of population aged 75+ than Slough.
Wherever one looks at the provision of care on a local basis – every area is so, so different.
Less than 20% of local authorities are within 5% plus or minus the national average supply levels, so in all the others potential residents will either get a viable choice of home or little or no choice if they want to stay local, and providers will either find it easier to fill their homes, or struggle to get to a viable occupancy level, depending on where they are located.
It’s a bit of a mouthful but a “local authority lottery” operates across the country.
At CSI we work outwards from a location as it is the only way to accurately see what a provider has to deal with in the area within which they trade.
The many corporations clamouring to invest or grow in the sector need to ensure that each location they consider is not immersed in an over supplied area, and by developing new homes in areas that need them this will also help give potential residents a good selection of care.
Back To Top
7 Years
The number 7 has many spiritual and symbolic connotations.
This editorial was for Care Home Environment magazine April 2022
In modern times it is seen as lucky in the game of bingo, yet one supposedly gets seven years bad luck if mirrors are broken. In entertainment it can be either Secret or Magnificent and I imagine would have been the title of an Adele album if she had been able to write songs at that age.
Since the beginning of time the number symbolised the day of rest after the creation of the World and the followers of Pythagoras said the number 7 meant spirituality.
There are seven days of the week, seven seas and seven wonders of the World.
But what relevance does the number seven have to this article I hear you impatiently ask?
Well for seven years I have written and published the CSI annual report on openings and closures of care homes for older people in England, so I thought it would be symbolic to look back on what has happened over that period.
Has it been a lucky period for the sector, or did someone break a mirror somewhere around the start of 2015?
If a care home opening is good news, and a closure is not so good then overall it has been pretty bad, as around two homes closed for every one that opened (around 1,800 against 950) although around 250 closed homes have since “re-opened”, usually with new owners.
But as the new homes have been around 60% larger than those that have closed the loss of beds has not been in the same ratio as care homes. Additionally, extensions have brought increased capacity to more than one thousand existing homes. This has meant that the number beds actually grew albeit by a nominal 0.5% during that time period, and there are currently around 405,000 beds available.
And one must of course remember that during those seven years up to 56,000 vulnerable people would have been displaced when their home was closed. Certainly not lucky for them.
Additionally over that period the 75 plus population, that accounts for around 90% of all occupied care home beds, has grown by around 900,000, meaning that whilst there were 91 beds for every thousand people in that age group in 2015, we began 2022 with just 77 beds, a decrease of 16%.
Lang Buisson has a 10-year aged-based formula for calculating the number of people requiring a care home bed in England called Age Standardised Demand (ASD). Using their formula in 2015 meant that 342,000 people would have required a care home bed – therefore around 85% of the total bed capacity.
That same formula at the beginning of this year increases by around 57,000 to 399,000 – almost as many people are there are beds available. So with estimated average occupancy levels currently recovering for as low as 75%, there is obviously a smaller percentage of people within the older age groups in a care home.
The dark COVID days brought with them a reduction in occupancy levels as relatives refrained from placing their loved ones into what were locked down care homes, with little hope of visitation.
It will be interesting to see whether the pre-COVID levels return, or whether people will look more towards care in the community.
If levels do return to the levels forecast in Laing Buisson’s ASD model, then availability of beds may well be an issue, but I foresee a review of what share of each age group are needing a care home bed.
With the equivalent of 10% of all care homes opening over seven years, and around 20% closing, it has brought with it a change in the shape of the market.
Nursing dementia grew in market share from 26% of homes in 2015 to 30% in 2022, with residential dementia growing from 37% to 42% in the same period (Chart 1)
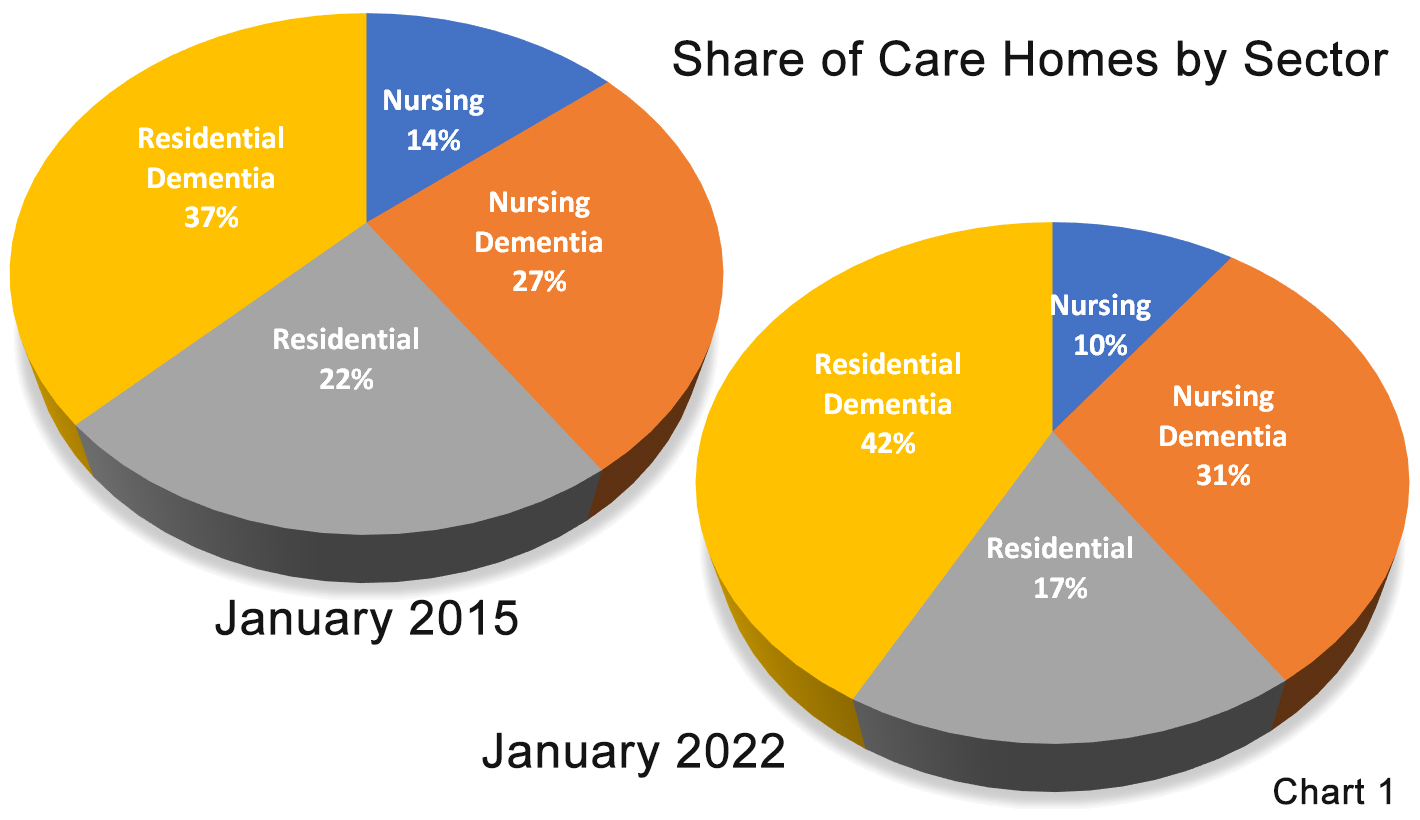
Due to the fact that the newer dementia home is larger than average, the share of dementia beds is currently even greater with a 42% share for nursing dementia and 37% for residential dementia, meaning that currently around eight of every ten care home beds are in a dementia home.
On a regional basis, overall there has been very little change with regard to market share, with only around half a percent change across the nine regions. However at Local Authority level there have been some major changes.
Out of 150 authorities, eleven grew their care homes by more than 10% (Table 2).
Eight of these authorities are located across the middle of England. Looking at their supply levels compared to England , most needed this growth to bring them up towards the national supply levels, with the exception of Stoke On Trent who now have much higher supply levels compared to national averages (so it must be questioned how planning permissions continued to be given by the local authority during that time is supply levels had been considered.)
Twelve local authorities lost more than 20% of their care homes over the seven year period (Table 3), and eight of these are in London, the lowest supplied region in the country.
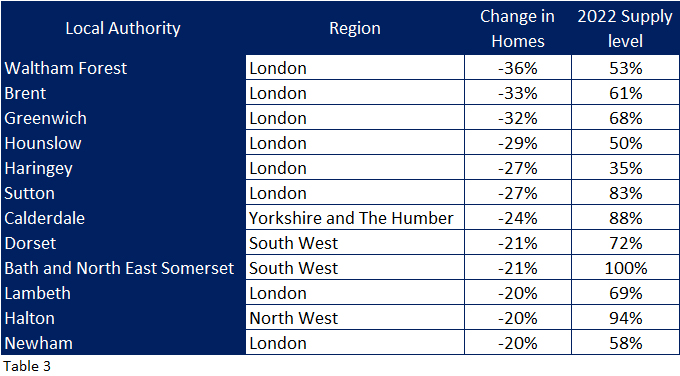
With the exception of Bath and North East Somerset and Halton, all the local authorities have much lower than average supply levels and therefore cannot really have afforded losing such a large share of their care homes. One hopes that the adult social services in these local authorities have a plan to improve supply levels within their remits.
Those who do not understand the care home sector (this list would include the media and certain people within Government) believe it to be dominated by global off-shore set ups who take local authority funding and spend it on shareholders rather than residents, as a recent Panorama programme suggested.
In reality whilst it is dominated by the private sector, having around 84% market share most providers are small concerns, not the big players.
The industry-recognised “Top Six” had an 11% market share in 2015, which has since dropped below 10%, albeit mixed fortunes for those providers. (Table 4)
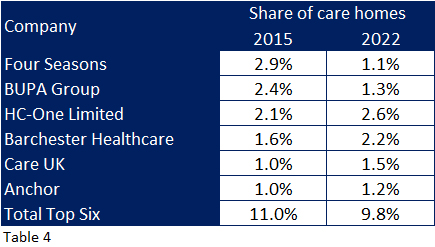
Four Seasons and BUPA held one and two rankings with around 5.3% share in 2015 which has dwindled to 2.4% and the loss of nearly 600 homes and 20,000 beds between them, albeit only around ten per cent were closed, the majority being sold on.
The remaining four providers have increased their market shares by up to half a percent with HC-One and Barchester respectively now taking the over the top two rankings.
It is interesting to note that at the other end of the business scale, whilst these “top six” operate around 950 care homes, 380 homes are owned by individuals i.e. sole proprietors or partnerships who do not even have the relative protection of a limited company let alone a complicated corporate structure to hide behind.
So what about the next seven years?
As this editorial is published, millions of people will be readying themselves for an extra 1.5% to come out of their end of month wage packets to help the NHS catch up on a long waiting list caused by COVID, and also to “fix social care,” albeit with the vast majority of the income going to the former.
However, although we now have a new government initiative to increase financial support for social care we can still not be certain how the sector will be funded and managed in seven years-time.
One thing we do know is that the older age population will grow at speed, whilst the working age population is not expected to grow at all.
In 2015 the 75 plus population in England was around 4.4 million, this year it has reached around 5.3 million and by 2029 it will be 6.3 million – that is 43% higher than 2015.
The working age population did grow from around 32 million in 2015 to 32.8 million in 2022 but is expected to stay at this figure in 2029.
So in theory more people will need beds, but there will not be any extra people around to care for them, which shows the need to encourage working age people into the sector, so working conditions and pay must improve in this respect.
Currently the number of new investors and care home developments seems to be accelerating, and surprisingly the COVID situation did not prevent a year on year upward trend in care home openings from 2019 to 2021. These are predominantly large affairs, with top end facilities – built primarily to care for today’s private funded resident.
Subsequent new developments may need to appreciate that the current payment model could change – with the centrally funded share of resident increasing at the expense of the self-funder – and built to meet where the market is going, rather than where it currently sits.
And there is another factor in shaping the future of care provision and it involves people living with dementia in care homes.
In 2014 Alzheimer’s UK published a report with age specific dementia forecasts, along with estimates as to the share of people who were living with dementia in a care home. In very basic terms propensity to dementia nearly doubles by each five year age group from the age of 65, and the share of people living in a care home grows by around 50% for those between 85 and 89, and another 50% for those aged 90 plus.
Using their formulae, in 2015 there would have been around 260,000 people who were living with dementia in a care home, growing to 315,000 by this year, and a forecast 395,000 in 2029.
So in effect what accounted for around 65% of available beds in 2015, now accounts for 78% (many providers currently confirm this by suggesting three out of four people in their care have dementia) and is forecast to account for basically all current beds by 2029, unless there are more beds available by then.
However, with medical advances that have been achieved over the years, and what was achieved so quickly with COVID vaccinations, this must suggest that (desperately needed) it must be hoped that developments with dementia can also be achieved, ideally to eradicate the disease, but more realistically to delay its development.
If, for example the onset and development of dementia in individuals can be delayed by five years (compared with Alzheimer’s estimates) this would achieve a massive improvement in the quality of life for so many people and their families, and a huge reduction in the number of them requiring a care home bed.
In fact the forecast 395,000 for 2029 would reduce to 230,000 – less than those thought to have been living with dementia in a care home back in 2015! What occupancy levels would we see if that happened? How would the market react?
So it seems whilst this editorial has highlighted the fact that in real terms care home bed supply has reduced over the last seven years, over the next seven years the way the market develops must consider both who will be paying for the care; private versus centrally funded within the new government initiative, and whether demand will continue at today’s level – especially if medical advances are achieved with dementia.
Back To Top
Where is Outstanding? 2021 Update

How to go from Outstanding to Inadequate? Change providers
In June last year CSI produced a report that looked at where the 420 care homes in England that had a CQC Outstanding rating were located and discovered 8% of all local authorities made up 25% of the Outstanding homes, whilst more than a quarter of them did not have a single home that could boast this top rating.
A year on I have analysed the current situation and can report that:
- No care home caring for older people has since been promoted to an Outstanding rating since then
- 3 care homes were re-inspected and retained their Outstanding ratings – well done to them
- 12 Outstanding care homes have changed provider and as yet have not been inspected under the new ownership
- 1 Outstanding care home has changed provider – and has now been given an Inadequate rating
- 1 Outstanding care home has closed (as identified in my report Say Hello Wave Goodbye 2020)
- 3 homes have since had their Outstanding ratings relegated to Good (one home) and Requires Improvement (two homes)
With regard to no new homes being awarded an Outstanding rating, during these COVID laden months the number of CQC inspections had been reduced to the number of visits to homes, and when undertaken these were more about inspecting homes where the CQC had concerns over care quality and resident safety.
And with regard to the home going from Outstanding to Inadequate? CSI will not give more details, other than to say that just by buying an already Outstanding care home doesn't guarantee a continuation of that accolade - far from it in this case.
We will wait to see what will happen to the other 12 Outstanding care homes that have changed ownership and have still to experience an inspection. We wish them well.
The original report still holds true and makes very interesting reading and can be seen here.
Back To Top
CSI investigates the CQC COVID-19 Insight into care home deaths

If you would like to read this report as a pdf click here
I will preface this investigation by saying that whilst I normally enjoy cutting through data and creating my reports and insights, and fulfilling my clients' needs, this particular subject is one that is hard to cover. As the CQC themselves say “every number represents a life lost”, but it is one that needs to be published to hopefully help us all understand what has happened over the pandemic period across all care homes in England.
On 21st July the CQC published the number of deaths attributed to COVID by individual care home – something they initially said they would not do.
Whilst the analysis lists the individual care home numbers (they do publish a Microsoft Power BI dashboard) this is only a glimpse into what really went on. It presents deaths attributed to COVID-19 in isolation, without also showing the total number of deaths, through natural causes, or other reasons such as influenza.
In October 2020 the ONS estimated there were 15,356 deaths in care homes attributable to COVID-19 between April and September 2020, but these accounted for 17% of the nearly 95,000 care home deaths during that same period. The latest CQC figure is 23% higher, but still accounts for just one in four of all care home deaths during that period.
Surely including deaths due to other causes may have give more relevance to the CQC analysis?
Less than 7,000 care homes are listed with attributable deaths, out of the 15,500 homes that were operation across that period. And 50% of the recorded COVID-19 deaths were in just over 1,400 care homes, that’s just 9% of all care homes.
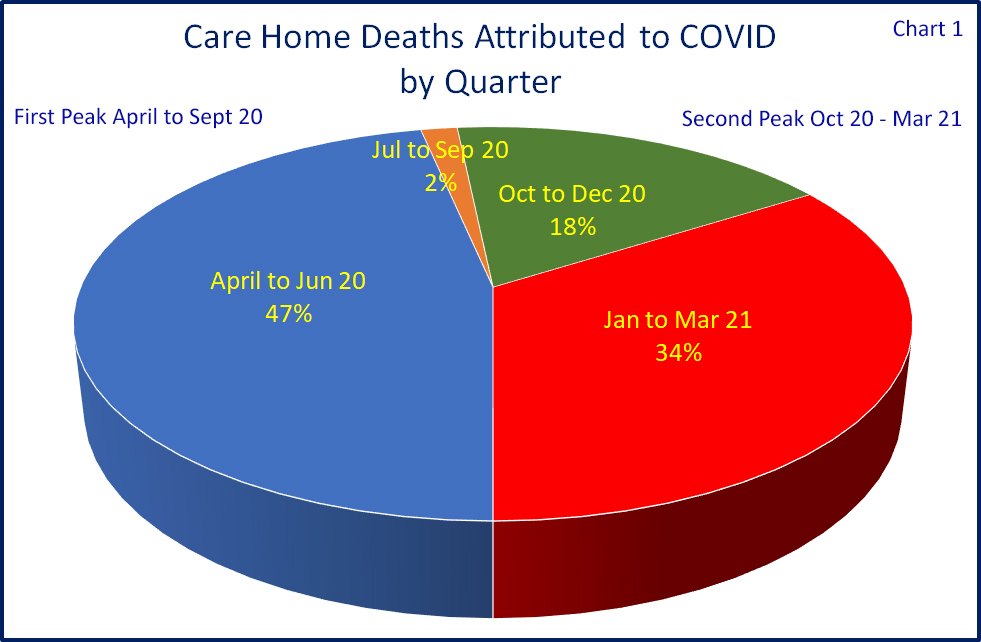
The CQC figures cover four quarters that include two separate peaks in the number of deaths – firstly those early on in the pre-testing, pre-suitable PPE days of April and May 2020, and those in the second “winter” peak – representing two most different periods.
Basing these two peak periods on; April to September 2020 as the first and; October 2020 to March 2021 as the second, out of over 39,250 attributed deaths 48% were in the first peak and 52% the second.
In the following charts I have analysed the number of deaths by indexing them against the total number of beds nationally. So if a sector accounts for 50% of all mortalities, and 50% of all beds, this would be in line with the national average, and indexed at 100. Anything above an index of 100 would mean a relatively higher number of attributable mortalities, below 100 would mean a relatively lower number, the higher or lower the index the greater the variation on the national average.
We have not highlighted individual homes and focused on higher measurement levels.
But before we look at these measurements it is interesting to note that 56% of all care homes in England did not have a single death attributed to COVID-19, whilst a further 20% had single figure percentages based on their number of beds. Of care homes caring for older people these figures were 40% and 27% respectively.
So it is concerning that whilst over a half of all care homes managed it through these terrible times without a single death, ALL care homes are being asked to get rid of non-vaccinated care workers, those same people who spent all those months keeping infections and deaths away without proper protection, and definitely without the availability of said vaccinations.
Size of home
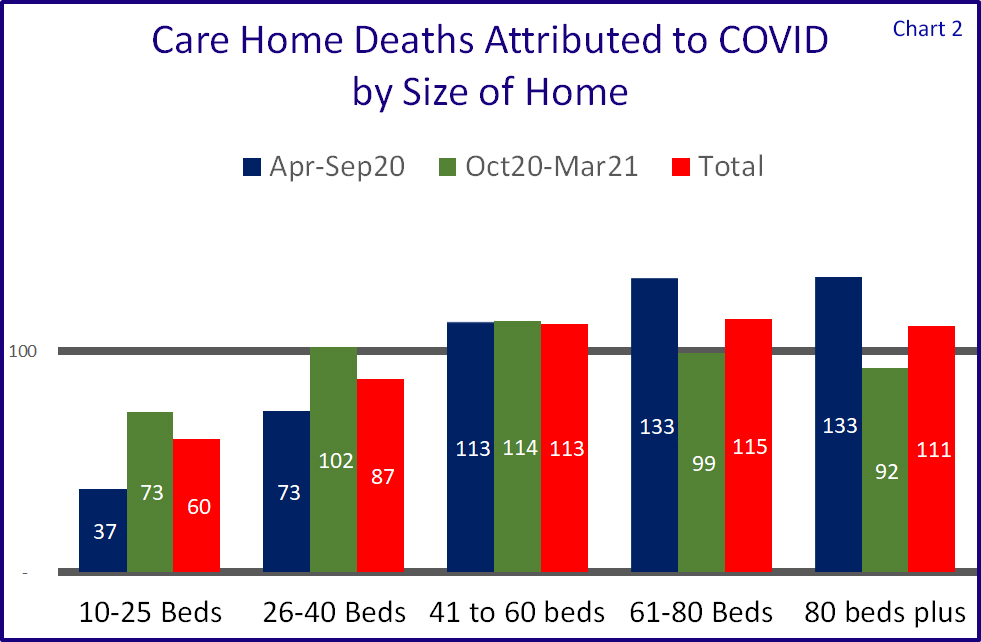
We were hearing that the larger the home, the higher the chance of mortalities and whilst this is substantiated by our research into the CQC data for the first peak, this is not so true for the second.
Chart 2 shows that in the first peak care homes of 61 beds or more were about one third higher than the average, but in the second peak they were below the national average.
Throughout both peaks mid-sized care homes of between 41 and 60 beds were around 13% above the national average, the 26-40 sector was around 73% in the first peak and just above the national average in the second.
Relative safety could be found in the smallest sized sector, albeit not so much in the second peak.
Please note that the CQC did not publish quarterly figures for homes of 10 beds or less “as data considered personally identifiable at quarterly level and has therefore only the total figure presented for data protection purposes.”
The impact of dementia
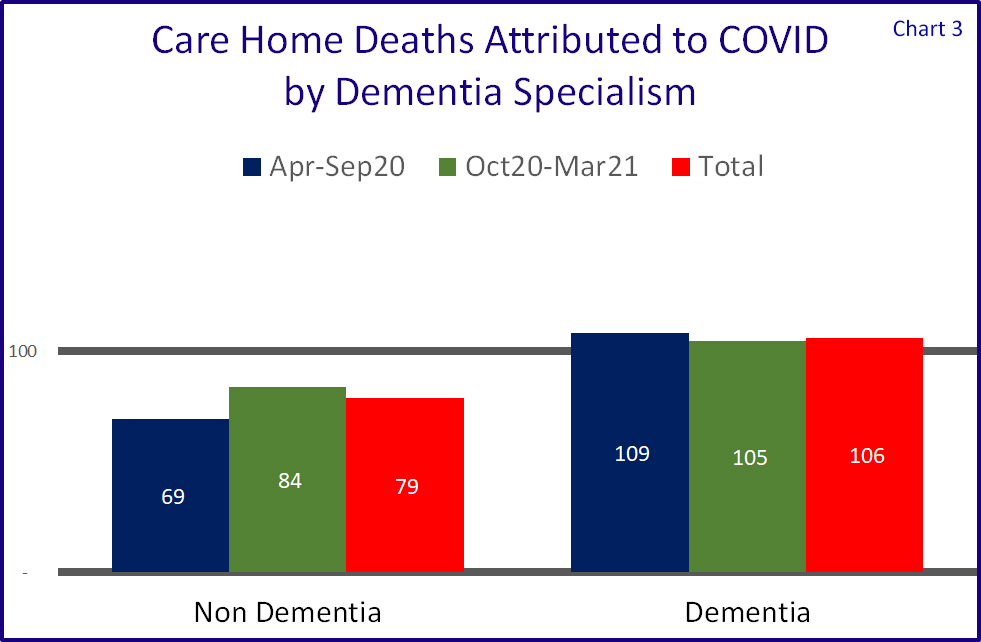
Where a care home is caring for people living with dementia, it is understood that getting residents to comply with social distancing is harder. Whilst this cannot be seen as the all-embracing rationale for higher mortality levels, this is in fact the case as is shown in Chart 3, albeit dementia homes are in total only around 6% above the average.
Residential or Nursing?
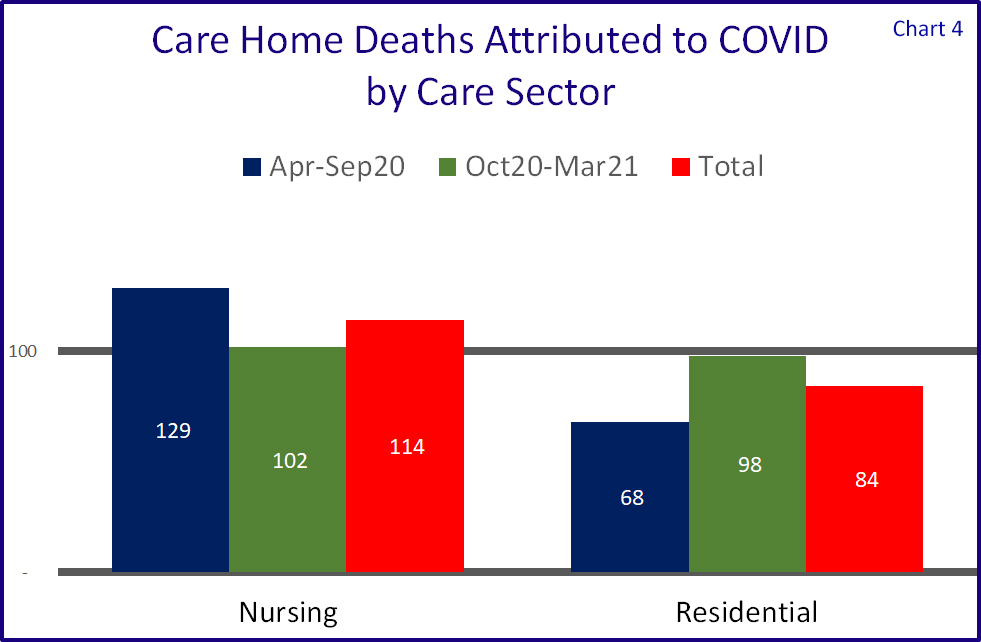
Chart 4 shows that attributable mortalities were far more prevalent in care homes with nursing in the first peak, but things relatively levelled out in the second.
One may say that "Nursing Homes are by definition larger than dementia homes", but these figures are based on percentage of deaths attributted to COVID-19, not the total number.
Care Quality
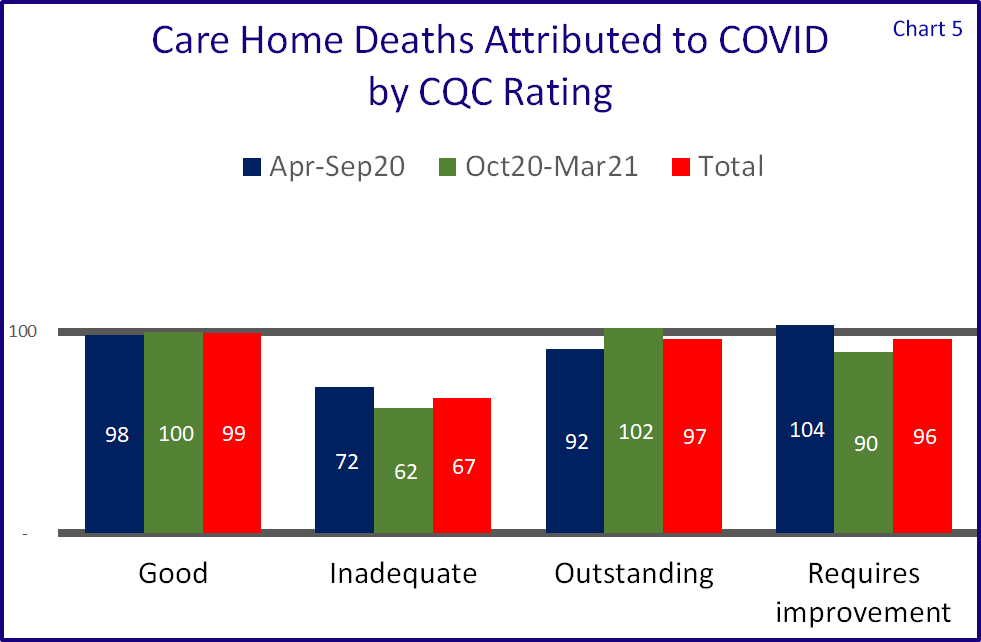
When publishing this data the CQC states “Death notifications alone are not a reliable indicator of quality or safety” – but we must assume that their CQC ratings are exactly that; an indicator of quality and safety.
So how did the care homes fare when aligned to their CQC rating.
Chart 5 shows that homes with a Good, Outstanding or Requires improvement ratings were very much in line with the national average.
Homes with Inadequate ratings actually performed the best (probably the wrong phrase to use, sorry) but a caveat here is that the measurements are based on total beds, and one can assume that homes with such a rating would have lower occupancy levels which would mean that a) whilst it cannot be measured, attributable mortalities against number of actual residents will be relatively higher than total registrations and b) a half empty home would allow more space between carer workers and residents. They also only account for around 1.5% of all homes.
So in summary we can agree with the CQC that “Death notifications alone are not a reliable indicator of quality or safety.”

Company Sector
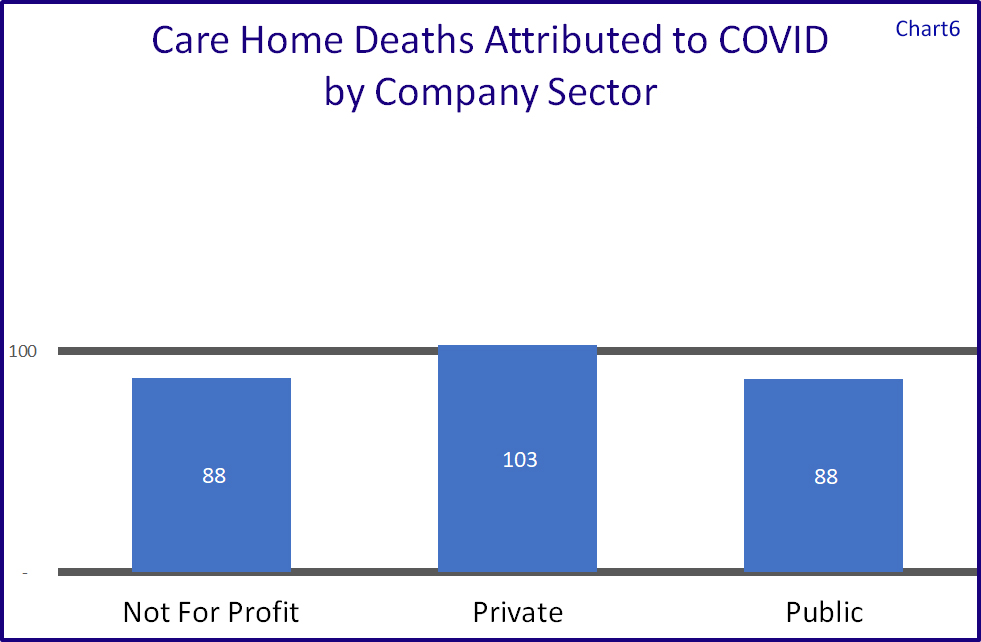
Broken down by the provider company sector we see in Chart 6 that the not for profit and public sectors fared better than the private sector, the latter having a slightly higher number of attributable mortalities against their total number of beds.
Another interesting fact is that whilst 40% of all care homes that cared for Older People did not register a single death attributable to COVID-19, when broken down by Company Sector this grows to 45% for the for not for profit sector, against 39% for private ownership and 47% for the public sector.
When one includes all care homes the percentage of homes without a single death in the not for profit sector was around 65%, with around 53% in the private sector and 59% in the public sector.
Whilst this will include care homes with less than 10 beds who will have stood a better chance of escaping casualties, these same homes are included within the blanket requirement for all care workers to be vaccinated, and so these figures are valid.
Regional variations
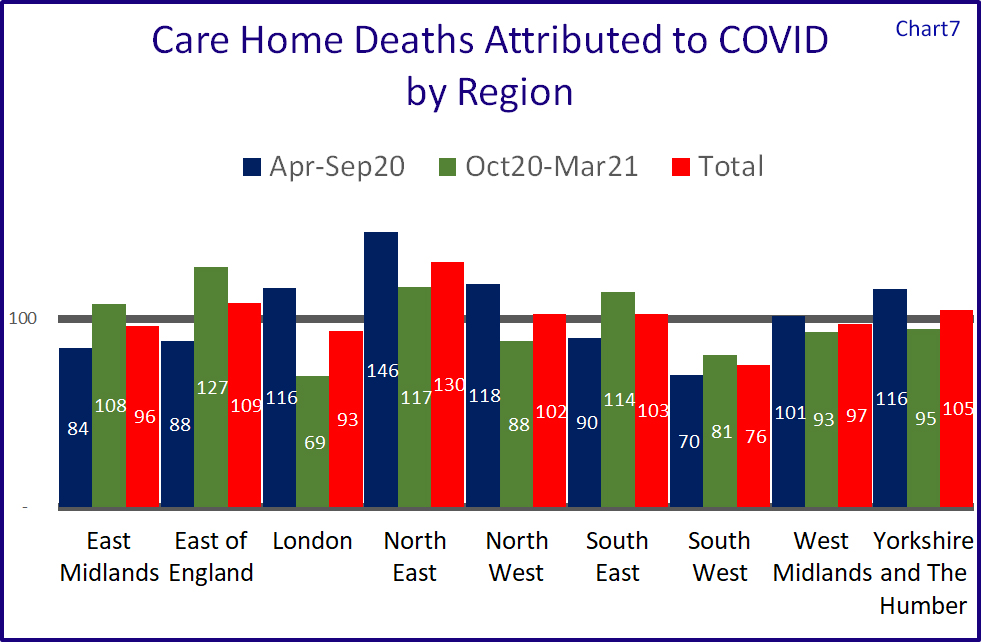
Chart 7 shows the relative performances of the nine regions. Northern regions appear to have come off worse during the first peak, with North East indexed at 146, North West at 118 and Yorkshire and Humberside at 116. London was also above within this phase at 116.
The North East was also above the national average in the second peak, as were East of England and South East.
The region with the lowest attributable mortalities is the South West which also has the lowest number of people per square km.
Local Authorities least and most affected
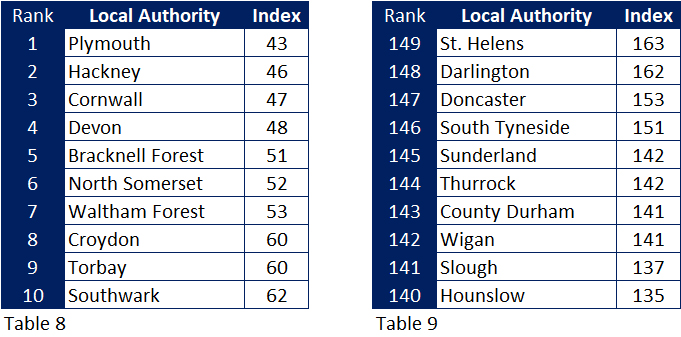
Indexing the number of attributable mortalities to the number of beds in each local authority I have shown the 10 least affected (Table 8) and most affected (Table 9) Of the ten least affected authorities, five are in the South West, four in London and one in Berkshire.
Seven of the most affected are Northern authorities, two (again) in London, and (again) one in Berkshire.
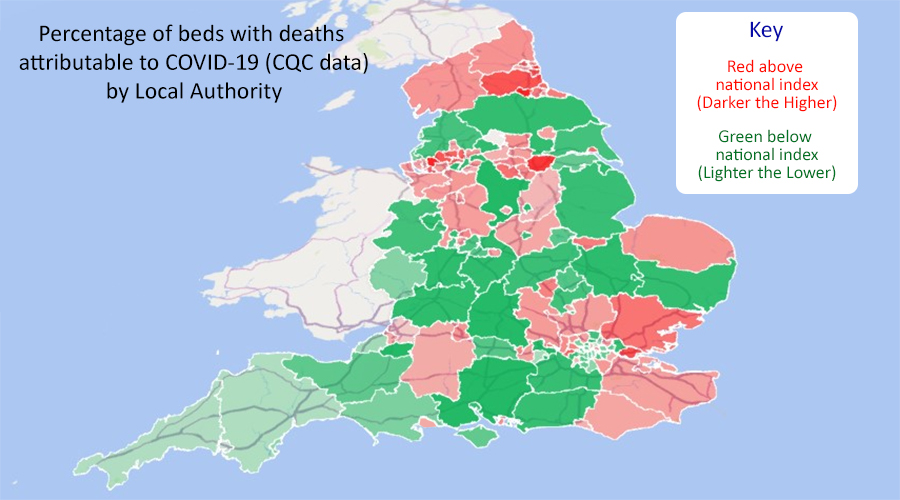
The map shows the affects for each Local Authority. The reds are equal to or above the 100 index the darker the higher the index. The greens are below the 100 index the lighter the lower the index.
Summary
In summary the CQC insight is a sad reminder of all the personal losses that the COVID-19 pandemic has brought but is in itself not a full picture of mortalities within care homes over that period, when mortality rates are by definition high due to the age groups and vulnerability of those people living in such an environment.
Larger homes had a greater share of deaths attributable to COVID-19 in the first peak, but this was not the case in the second, whilst there was a higher prevalence in homes specialising in dementia, and in nursing homes. A care homes CQC rating did not seem to have a bearing on the numbers issued by the CQC.
On a geographical basis prevalence was higher in the northern regions.
What the figures do show, however that a majority of care homes managed their way through these traumatic times without a single death, even though half of the mortalities were during the times when the homes were blatantly unprotected from the infection.
Such a superb performance does not warrant a blanket Government ban on non-vaccinated employees after November this year, and we should instead rely on the continuation of the testing programme.
Back To Top
Keeping A Close Eye on the Transfer Market
CSI compares the Football transfer market to that in the care home sector
So with the European Championship out of the way we (i.e. the long term footie fans rather than those nouveau fans entranced by Mr Grealish and co.) look forward to the next season that will begin in August, paying particular attention to the transfer market – and “will they, won’t they move, and if so to where?”
Will those loyal stalwarts Harry Kane and the aforementioned Jack Grealish finally leave their beloved Tottenham and Aston Villa? And if so, for how much?
And whether they do or not (and they probably will) they will not be the only ones to move.
One thing than I can say for certain. A footballer with probably a ten year life span (as a player not on this earth) will sell for exponentially more than a care home that will have a much longer lease or even a lifelong freehold.
For a long time now, and as a service to my clients, I have been monitoring the care home transfer market, and registering who is sold to whom, and who is still sitting in the wings – or on the subs bench - waiting to be sold. (Some have been on that bench for over 5 years, so I imagine their backsides are getting a bit numb, and their agents a bit nervous.)
In summary around 5% of all care homes have changed teams over the last two and a half years, but it is definitely not a case of the big clubs (and especially those with foreign ownership) buying them all up, and if anything one big club (massively relegated from the premiership I am afraid) is selling more than any other, with another, still in the top tier, openly stating that they wish to sell a sizeable share of their squad to smaller local teams.
In fact on average there have been just 1.3 purchases per buyer, and for around two thirds the purchase is their only care home.
There is however recently one piece of hot transfer news where one provider with two brand names has sold out to two other providers, that being Sunrise Senior Living and Gracewell Healthcare selling a mix of their portfolios to Care UK and Senior Lifestyle – 46 locations involved.
As we hopefully close in on some form of social care reform, we still hear from the uneducated that extra Government investment would only line the pockets of the “vultures” (just seen that term on Twitter) and their off shore businesses with numerous yachts per shareholder.
This is certainly not the case with recent transfers and nor is it the case with the total market in which the Top 6, the care home equivalent of the two Manchester clubs, Liverpool, Chelsea, Tottenham, and Arsenal account for less than 10% of all care homes, the rest being owned by small providers with only 2 homes each on average.
So whilst we all watch the TV news and scroll through the football websites for the latest transfer news, I will continue to check out what is going on in the care home transfer market. Let me know if you want some more information or want to get involved in the market.
Back To Top
Where id Outstanding?

CSI investigates the awarding of Outstanding ratings to care homes for older people, and asks what is Outstanding, but more importantly – WHERE IS IT?
Like most words in the English language “Outstanding” can mean different things.
For starters it reminds me of an old joke that was recently re-posted on Facebook.
“I had a letter from the HMRC today saying that my self-assessment tax return was OUTSTANDING. This really pleased me, although to be honest I cannot remember sending one.”
The other definition of Outstanding of course is exceptionally good, and in the Care Sector the term is used by the CQC as the highest rating possible from their inspections. The national association Care England has an Outstanding Society where members who enjoy this plaudit for one or more of their homes, can share best practices.
Recently Carterwood published a report that said that care homes for older people with an outstanding rating charged an average 20.6% premium for self-funding clients. Whether local authorities are willing to pay such a premium was not recorded.
Many industry commentators have written about what Outstanding is and a number of suppliers offer assistance to care providers to attain such a rating.
In this investigation CSI breaks down exactly how many Outstanding care homes there are in England, their size and care sector – residential, nursing, dementia, but more importantly,(having done the research already I know how interesting this is), where they are.
Across England there are around currently 420 care homes for older people with an outstanding rating, so around one in every 24 homes.
Only 19 homes (4.5%) got Outstanding in all five categories with over 60% of these top performers coming from just 4 local authorities – 3 from Nottinghamshire and 2 each from Bournemouth Poole and Dorset, Oxfordshire, and West Sussex.
Half of all homes boasting Outstanding achieved this with just two out of five categories at this level, the remaining three ratings being Good.
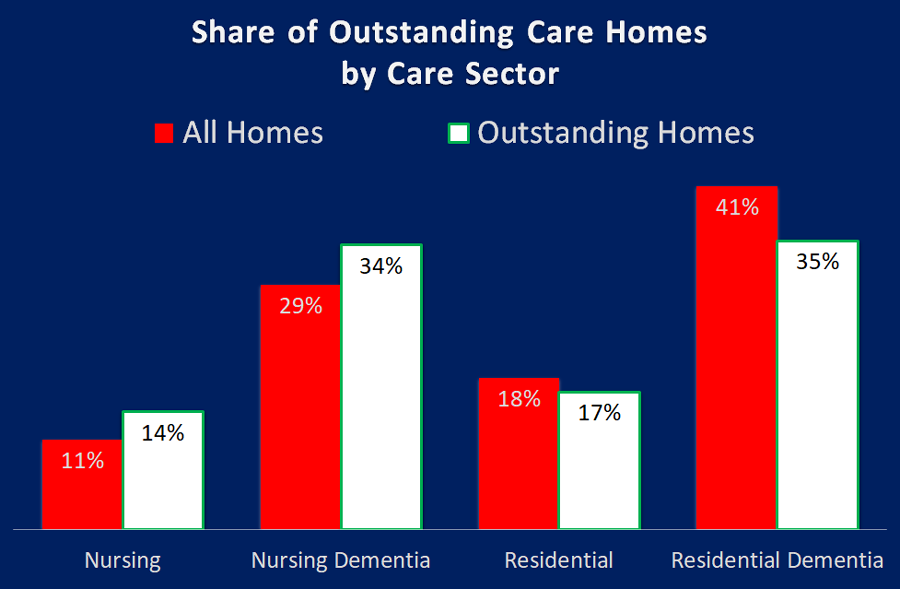
As can be seen from the chart above, nursing homes, both with and without dementia, perform better than residential homes, achieving 48% of all Outstanding ratings, whilst accounting for just 40% of all homes.
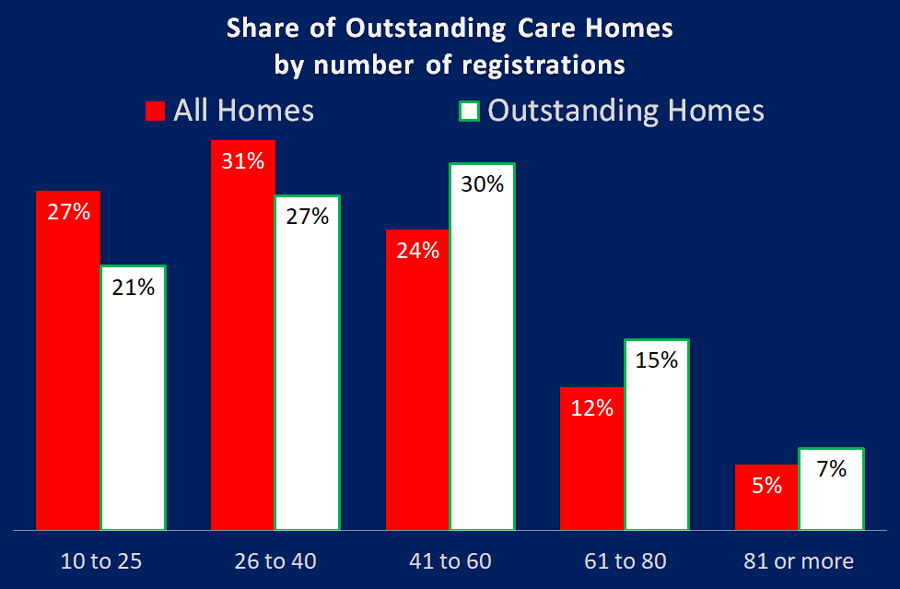
It certainly appears to when it comes to being Outstanding. The chart above shows that smaller to medium homes account for 58% of all homes, but only 48% of Outstanding homes. The larger homes, 41 beds or more account for 41% of homes but 52% of all Outstanding ratings.
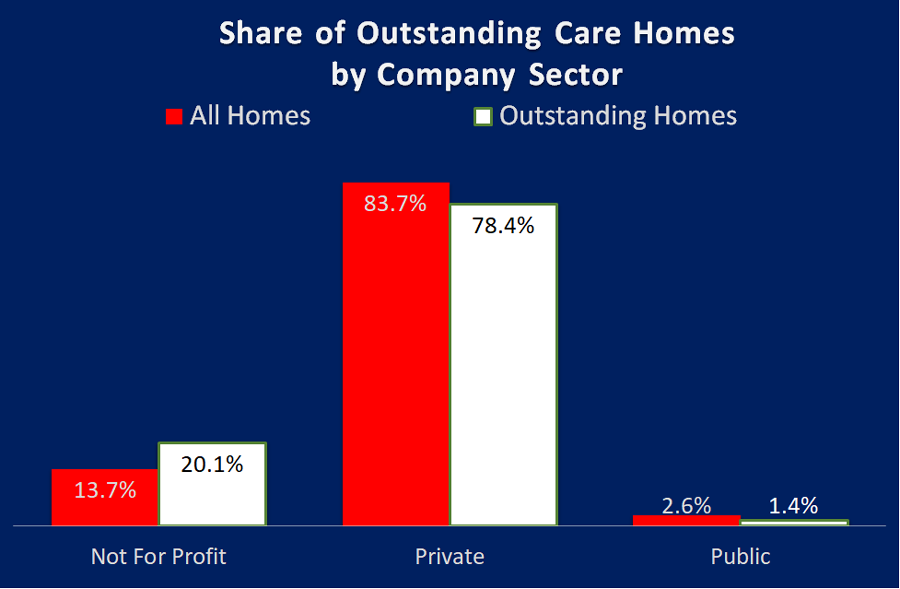
I thought the best way to comment on the table above was to leave it to Liz Jones, Policy Director for the National Care Forum, "the leading voice for not-for-profit care providers", "Valuable insight here, as ever, from CSI Market Intelligence with an analysis of the outstanding ratings by the CQC. Delighted to see the strong showing from the NFP sector here, with the finding that while our sector accounts for just under 14% of all care homes for older people, the Not For Profit sector has a 20% share of all Outstanding ratings - #HereToCare!"
I have noticed a polarisation of Outstanding care homes into small geographical areas I have delved deeper and looked at variances at regional, local authority and town / city level.
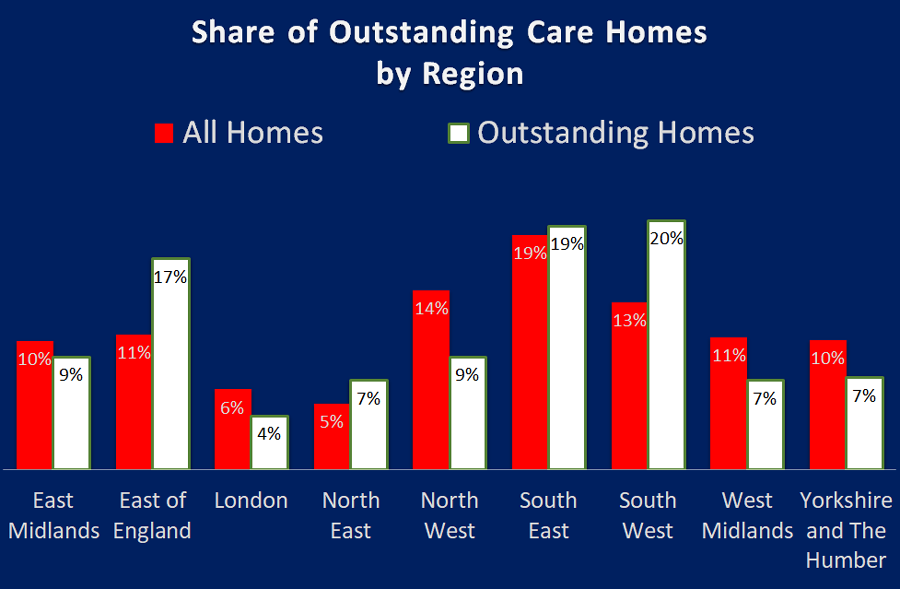
The regional picture is pretty clear. The biggest winners are South West and East of England with a 7% and 6% higher share respectively for Outstandings compared to their total share of homes in the regions.
The biggest losers are the North West, West Midlands and Yorkshire and Humberside have respectively, a 5%, 4% and 3% lower share of Outstandings than they do share of homes.
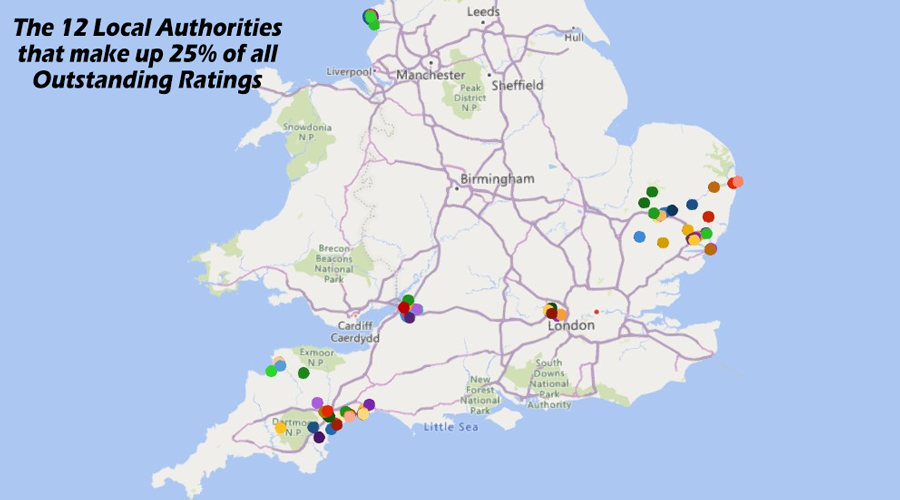
The map below shows these clusters of Outstanding homes that make up the 25% share. Apologies that the map only extends up to Leeds, but no Local Authorites north of this line are in the top 8%.
Top of the tree was Kensington and Chelsea, with two out of their seven homes rated Outstanding. Their great performance is so different to other London boroughs. They are followed by South Gloucestershire who have 10 out of 41 inspected care homes being rated Outstanding which is five and a half times the national average.
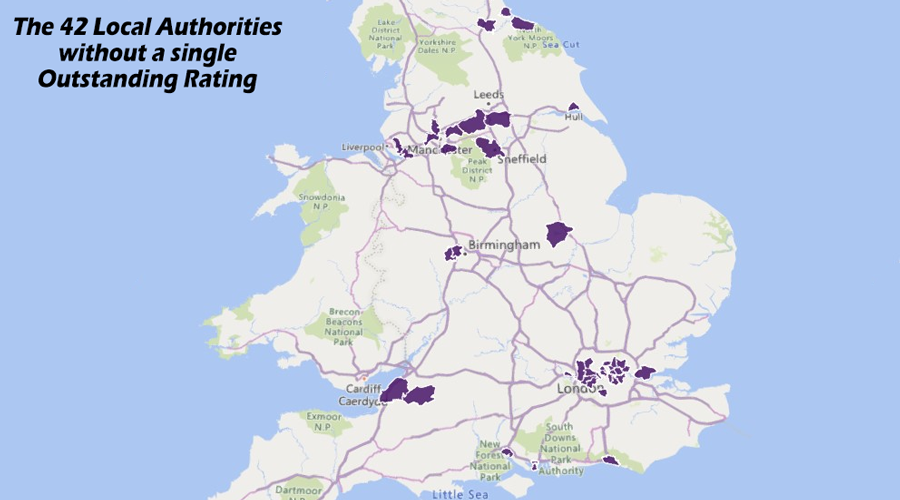
At the bottom, 42 Local Authorities cannot boast a single Outstanding rating out of 1,150 care homes that have been inspected. Nearly half of these (19) are London authorities, and 6 are in the North West making up a total of 60% of the national picture between them.
This second map shows the Local Authorities without an Outstanding home.
Many other towns with lots of homes but no Outstanding ratings include The Wirral, Chesterfield, Weston Super Mare, Oldham, Huddersfield, Torquay, Hove (near Brighton), and Gloucester (this is interesting at the town is close to South Gloucestershire that was at the top of the list of Outstanding performers)
Ignoring towns with just a few care homes, top of the Outstanding charts include Sidmouth and Seaton, who are just 10 miles apart and who have a total of 10 out of 19 homes that are Outstanding – that is 53%, or 12 times the national average.
The top 12 local authorities share of self-funders is much in line with the national average as forecast by Laing and Buisson and included in the CMA final market report in 2019. The 42 without an Outstanding averaged about 60% of the national forecasts, but the sample did include some local authorities that enjoyed above average levels.
And as far as local authority contributions, which we know vary greatly across the country, there was little difference between those at the top and those at the bottom. Using the latest iBCF data for 2018/19 the average contributions were basically in line with national averages across both samples.
So a decent share of self-funding income does help with attaining Outstanding, and conversely low levels affect that same attainment. But local authorities varying contributions is less of a factor, albeit a low contribution aligned to a low share of self-funders will have an impact.
So could it be that having a local competitor that is Outstanding, inspires others to attain this standard?
For a few years in my home town of Worthing we had just one care home with an Outstanding rating, but in the last 12 months or so three more have been added to that roll of honour.
In Blackpool, out of the six Outstanding homes that make up 12% of all the homes in the city, four belong to one provider, and this situation is repeated across the country in other Outstanding hotspots.
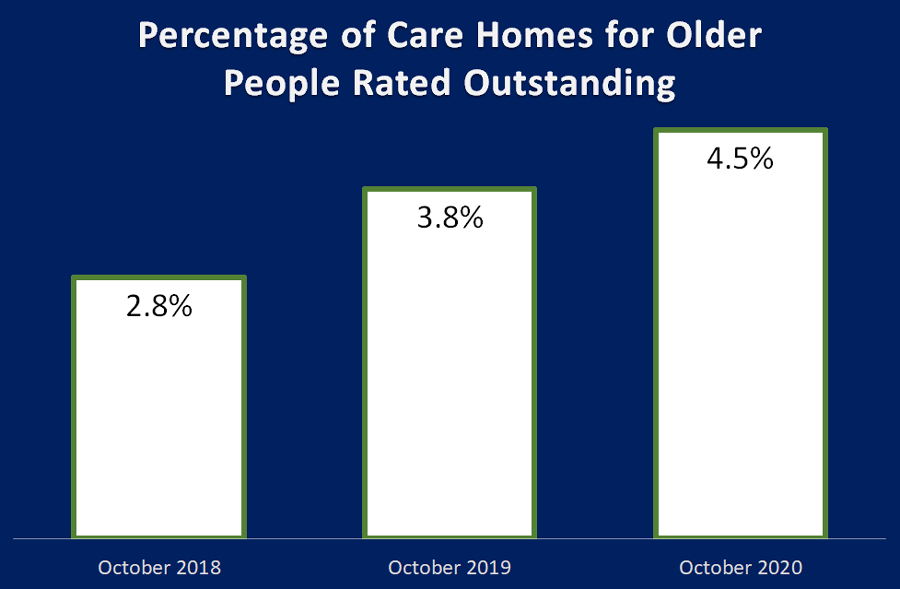
I am pleased to say we are, as we have grown from 2.8% outstanding in October 2018, to 3.8% in October 2019, and a year later we are up around 4.5%.
And it could be higher, as the number of CQC inspections in 2020 have dropped due to Covid-19, and those that have been undertaken since April have focused on homes where the CQC had concerns with homes rated Requires Improvement or Inadequate.
Around one fifth of current Outstanding care homes had their inspections published in 2020, and of these only a third already had an Outstanding rating. This means that about two thirds improved, predominantly from Good, but three homes were promoted from Requires Improvement, and on four occasions it was the first inspection, so well done to all of you.
July 2021 Update - to find out what has happened since read my update here
Like most words in the English language “Outstanding” can mean different things.
For starters it reminds me of an old joke that was recently re-posted on Facebook.
“I had a letter from the HMRC today saying that my self-assessment tax return was OUTSTANDING. This really pleased me, although to be honest I cannot remember sending one.”
The other definition of Outstanding of course is exceptionally good, and in the Care Sector the term is used by the CQC as the highest rating possible from their inspections. The national association Care England has an Outstanding Society where members who enjoy this plaudit for one or more of their homes, can share best practices.
Recently Carterwood published a report that said that care homes for older people with an outstanding rating charged an average 20.6% premium for self-funding clients. Whether local authorities are willing to pay such a premium was not recorded.
Many industry commentators have written about what Outstanding is and a number of suppliers offer assistance to care providers to attain such a rating.
In this investigation CSI breaks down exactly how many Outstanding care homes there are in England, their size and care sector – residential, nursing, dementia, but more importantly,(having done the research already I know how interesting this is), where they are.
Across England there are around currently 420 care homes for older people with an outstanding rating, so around one in every 24 homes.
When is an Outstanding rating awarded?
As most of you will know a CQC inspection rates a location across five categories Safe, Effective, Caring, Responsive and Well-led, as either Outstanding, Good, Requires Improvement and Inadequate. The same as for the Overall rating. To get an overall Outstanding rating the home needs at least two of the five categories to be Outstanding, and the remainder, Good.Only 19 homes (4.5%) got Outstanding in all five categories with over 60% of these top performers coming from just 4 local authorities – 3 from Nottinghamshire and 2 each from Bournemouth Poole and Dorset, Oxfordshire, and West Sussex.
Half of all homes boasting Outstanding achieved this with just two out of five categories at this level, the remaining three ratings being Good.
How do Care Homes perform by Sector?
As can be seen from the chart above, nursing homes, both with and without dementia, perform better than residential homes, achieving 48% of all Outstanding ratings, whilst accounting for just 40% of all homes.
Does size matter?
It certainly appears to when it comes to being Outstanding. The chart above shows that smaller to medium homes account for 58% of all homes, but only 48% of Outstanding homes. The larger homes, 41 beds or more account for 41% of homes but 52% of all Outstanding ratings.
What about the various business sectors?
I thought the best way to comment on the table above was to leave it to Liz Jones, Policy Director for the National Care Forum, "the leading voice for not-for-profit care providers", "Valuable insight here, as ever, from CSI Market Intelligence with an analysis of the outstanding ratings by the CQC. Delighted to see the strong showing from the NFP sector here, with the finding that while our sector accounts for just under 14% of all care homes for older people, the Not For Profit sector has a 20% share of all Outstanding ratings - #HereToCare!"
So where exactly are these Outstanding Care Homes?
And so to my headline question. Where is Outstanding?I have noticed a polarisation of Outstanding care homes into small geographical areas I have delved deeper and looked at variances at regional, local authority and town / city level.
Outstanding at a Regional level
The regional picture is pretty clear. The biggest winners are South West and East of England with a 7% and 6% higher share respectively for Outstandings compared to their total share of homes in the regions.
The biggest losers are the North West, West Midlands and Yorkshire and Humberside have respectively, a 5%, 4% and 3% lower share of Outstandings than they do share of homes.
Outstanding Homes by Local Authority
At Local Authority level I discovered that 12 out of 150 had between 2.5 and 6.4 times the national average percentage shares of Outstanding care homes, which means just 8% of all LAs provided 25% of all Outstanding ratings.The map below shows these clusters of Outstanding homes that make up the 25% share. Apologies that the map only extends up to Leeds, but no Local Authorites north of this line are in the top 8%.
Top of the tree was Kensington and Chelsea, with two out of their seven homes rated Outstanding. Their great performance is so different to other London boroughs. They are followed by South Gloucestershire who have 10 out of 41 inspected care homes being rated Outstanding which is five and a half times the national average.
At the bottom, 42 Local Authorities cannot boast a single Outstanding rating out of 1,150 care homes that have been inspected. Nearly half of these (19) are London authorities, and 6 are in the North West making up a total of 60% of the national picture between them.
This second map shows the Local Authorities without an Outstanding home.
So does my town have an Outstanding home?
A little over 1,200 towns or cites in England have a care home, but only 250 can boast an Outstanding home – so around 950 (nearly four out of five) do not have any! The largest city without an Outstanding is Sheffield, nearly 100 homes but not one top rating.Many other towns with lots of homes but no Outstanding ratings include The Wirral, Chesterfield, Weston Super Mare, Oldham, Huddersfield, Torquay, Hove (near Brighton), and Gloucester (this is interesting at the town is close to South Gloucestershire that was at the top of the list of Outstanding performers)
Ignoring towns with just a few care homes, top of the Outstanding charts include Sidmouth and Seaton, who are just 10 miles apart and who have a total of 10 out of 19 homes that are Outstanding – that is 53%, or 12 times the national average.
But (I hear you say) it’s all about money isn’t it?
To a certain extent it is, when it comes to the percentage of self-funders within any local authority.The top 12 local authorities share of self-funders is much in line with the national average as forecast by Laing and Buisson and included in the CMA final market report in 2019. The 42 without an Outstanding averaged about 60% of the national forecasts, but the sample did include some local authorities that enjoyed above average levels.
And as far as local authority contributions, which we know vary greatly across the country, there was little difference between those at the top and those at the bottom. Using the latest iBCF data for 2018/19 the average contributions were basically in line with national averages across both samples.
So a decent share of self-funding income does help with attaining Outstanding, and conversely low levels affect that same attainment. But local authorities varying contributions is less of a factor, albeit a low contribution aligned to a low share of self-funders will have an impact.
So why are we getting this geographical polarisation?
The cynic may well say that an Outstanding rather than Good rating is down to the subjective attitude of inspectors working this area, but this would totally undermine the massive efforts being put in by care groups and individual homes to up their game, and also one would believe that the CQC has measures in place to control this.So could it be that having a local competitor that is Outstanding, inspires others to attain this standard?
For a few years in my home town of Worthing we had just one care home with an Outstanding rating, but in the last 12 months or so three more have been added to that roll of honour.
In Blackpool, out of the six Outstanding homes that make up 12% of all the homes in the city, four belong to one provider, and this situation is repeated across the country in other Outstanding hotspots.
And finally – are we getting more Outstanding?
I am pleased to say we are, as we have grown from 2.8% outstanding in October 2018, to 3.8% in October 2019, and a year later we are up around 4.5%.
And it could be higher, as the number of CQC inspections in 2020 have dropped due to Covid-19, and those that have been undertaken since April have focused on homes where the CQC had concerns with homes rated Requires Improvement or Inadequate.
Around one fifth of current Outstanding care homes had their inspections published in 2020, and of these only a third already had an Outstanding rating. This means that about two thirds improved, predominantly from Good, but three homes were promoted from Requires Improvement, and on four occasions it was the first inspection, so well done to all of you.
So to summarise:
- Across England there are around currently 420 care homes for older people with an outstanding rating, so around one in every 24 homes.
- Only 19 homes (4.5%) got Outstanding in all five categories
- Half of all homes boasting Outstanding achieved just two out of five categories at this level, the remaining three ratings being Good.
- Nursing homes, both with and without dementia, perform better than residential homes
- Smaller to medium homes account for 58% of all homes, but only 48% of Outstanding homes.
- Larger homes, 41 beds or more account for 41% of homes but 52% with Outstanding ratings.
- Whilst accounting for just under 14% of all care homes for older people, the Not For Profit sector has a 20% share of all Outstanding ratings
- The biggest regional winners are South West and East of England sharing a 13% increase in share compared to the number of homes in the regions.
- The biggest regional losers are the North West, West Midlands and Yorkshire and Humber, losing 12% share between them. Just 12 (8% of all) LAs provided 25% of all Outstanding ratings.
- 42 Local Authorities cannot boast a single Outstanding rating
- Around 1,200 towns or cites in England have a care home, but only 250 can boast an Outstanding home – so around 950 (nearly four out of five) do not have any
- A decent share of self-funding income helps with attaining Outstanding, and conversely low levels affect that same attainment. But the local authorities varying contributions is less of a factor
- The share of Outstanding care homes has grown from 2.8% outstanding in October 2018, to 3.8% in October 2019, and a year later we are up around 4.5%.
July 2021 Update - to find out what has happened since read my update here
Back To Top
COVID impact of the Care Home Market

Earlier this year Editor Tim Probert asked if I would analyse what happened in the care home market during COVID-19 and put together an editorial for publication in one of the Autumn’s Care Home Environment magazines.
Well this is the editorial, but at the time of asking I think both of us thought it would as report saying, “this is what happened, now onwards and (hopefully) upwards”.
Even as I am writing in September things are changing on a daily basis, and the Government’s mis-management, specifically with regard to regular testing in care homes, policy U-Turns and with lockdown being eased and once again tightened, and above all their unmet promise to “fix social care” - it means that we are all still in turmoil.
We are all extremely worried about how a second spike of the Virus will continue to affect those operating, working and living in care homes going into the colder Winter months, not to mention the ability of relatives, like myself to eventually visit their loved ones.
As the virus, arguments and lobbying continues, I have looked at what has been happening within this market sector with regard to openings, closures and changes of ownerships both in the first quarter of 2020 (Pre-COVID) and the subsequent “COVID months” between April and August.
Obviously, openings and changes of ownership do not happen overnight, but by measuring what did occur we can estimate to some extent what pent up activity is likely to occur if and when the COVID dust settles.
Just to put in place a starting point and context of where we were at the start of 2020, the number of care home beds in England had shrunk by around 10,000 (2.5%) over 5 years due to higher levels of closures than openings, whilst the 75 plus population, that accounts for around 90% of all care home beds, has grown by around nearly half a million (11%) during that same period. That same age group will grow by a further 19% by 2025, and so a reversal in current trends is essential.
As CSI has repeatedly cited, supply levels across the country vary greatly. Areas of high supply have up to 150 beds per thousand population aged 75 plus, but as low as 26 beds per thousand where supply is low – so a 6 times variance.
So current supply levels are decreasing on a national basis and on a local basis are in a mess.
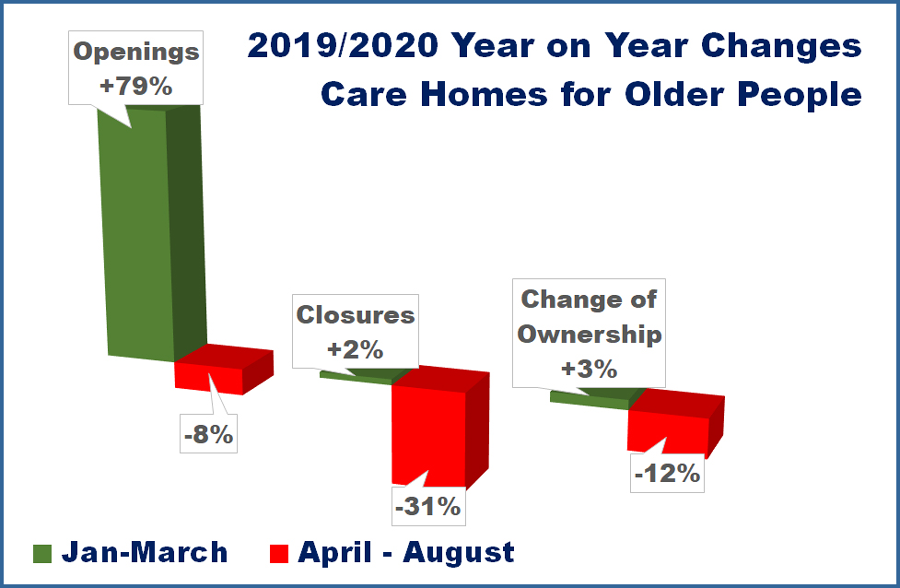
A Great Start to The Year
First the good news. 2020 started with promise, as care home openings during the first quarter were up by 79% year on year, with an 83% increase on the number of new beds.Then comes lockdown, and things stalled or even stopped as developers, investors, lenders, sellers, and buyers had to stop and take a deep breath.
From a 79% year on year increase prior to lockdown, openings during the “COVID months” dropped by 8% year on year. Without COVID 19, and if the year on year increase had continued from quarter one, there would have been an extra 50 new homes and a much needed 3,000 new beds.
There were 49 different providers across the 55 openings, with over a third of them as new providers – welcome to the sector guys!
There were four groups who between them made up about a fifth of all openings. The author did contact them for a comment on how they have fared filling the new beds but has had no responses to date in this respect – I imagine it will have been a slow process.
But at least closures are down, that’s good isn’t it?
In the first quarter closures were up by 2% year on year, but the number of beds lost actually dropped by 19%.And from April onwards closures dropped even further by 31% year on year.
This is probably due to the fact that homes that may have been thinking closure was imminent have found themselves committed to continue as they shield their vulnerable clients from the outside World, and are hopefully buoyed by whatever got through to them from the £4.3 billion of extra funding the Government gave to local authorities to help with public services, of which £600 million was ringfenced for social care.
Now in September there is a second spike in new COVID-19 cases, albeit deaths are very much down on the initial crisis, and the age profile of those testing positive in younger, but lockdown restrictions on social gatherings have once again be tightened, and there are still no guidelines as to visiting care homes.
This could well mean that strict shielding within care homes will continue through what will be the harder Winter months. Should this be the case a further tranche of money will be needed to support those homes who would otherwise have to close.
The Net Effect of Openings and Closures
Over recent years I have used the rule of thumb that for every care home that opens, two have closed. In 2020 it is more like two openings for three closures, and with the new homes being larger, by the end of August we lost 365 beds compared to 1,850 in the same period in 2019.The COVID-19 Effect on Occupancy Levels
Based on the information available from various sources I have had a shot at the change in occupancy levels in care homes between April and the end of August.(See Table 1)The generally recognised average occupancy levels across residential and nursing homes is around 90%, so 360,000 of the approximate 400,000 care home beds in homes registered for older people are filled.
The CMA Care Homes Market Study 2017 estimated 41% of care home beds were taken up by self-funders, with the remaining 59% local authority funded.
According to the ONS there have were around 66,000 deaths in care homes between April and August , including 14,683 attributed to COVID-19, and so without any re-admissions the care home population would have dropped below 300,000 an average 73% occupancy level.
According to CQC estimates in June there has been a reduction in the number of re-admissions to around 35% of last year for self-funders, and 72% of those funded by local authorities. When you multiply these percentages by the Nuffield Trust’s average admissions for every 100,000 population aged 65 plus in 2018/19, we can see that new admissions are much lower than those lost through deaths during the same period.
If this is accurate then occupancy levels will be down from 90% in April to 76% at the end of August, meaning homes will be missing the weekly income from around 55,000 residents or a reduction of 15%, which is a massive financial loss of income against already tight, and probably now negative, margins.
Knight Frank research published in September stated that they believe occupancy levels have more recently recovered to just above 80%, but still well below the pre-COVID levels.
But of course this is average. Supply levels and therefore occupancy levels will vary greatly on a local basis. And of course, there has not been a flat line COVID-19 death rate in all homes, with many not experiencing any deaths (although still tarred with the same brush with regard to new admissions) whilst other homes will have lost much higher than the average number of residents.
The CQC recently declined to report on COVID-19 deaths by home for commercial and confidentiality reasons, although they are quite happy to publicly brandish these same commercial ventures as anything between Outstanding and Inadequate via their inspections.
There is of course a longer term worry, and that is with regard to future capacity expectations for care homes in England. Should the existing concerns as to the safety of, and accessibility to loved ones within a care home continue, admission rates will stay low.
However there are somewhere between two thirds and three quarters of care home residents who are living with dementia at various levels of dependency.
It is difficult to know what other environment could properly manage a person’s dementia once it has reached a certain level of dependency, but it could well be that people with earlier stages of dementia that would previously been moved into a care home, may well be cared for longer in the community, which could reduce the care home population greatly.
Before COVID-19 some dementia care homes I have spoken to have told me that the level of dependency of newer admissions seems to be getting higher, so there is already a trend in this respect.
But at current rates the dementia population looked after in a care home is due to grow by around 16% over the next 5 years, and due to high mortality rates within that age group, the true growth of dementia means that by around 2027 the dementia population will be made up of people who have not been diagnosed as yet. So even if there is a shift from care homes to community care the dementia population within care homes will still be massive.
Above all this is of course is the hope that a cure for dementia, or a way of slowing its development, will come as soon as possible. Dementia is a massive influencer of the care home sector.
New Investment in existing homes
In addition to openings being well up year on year during the first quarter of 2020, sales and purchases were looking good as well, with a 3% increase in activities year on year.It is not surprising to see that this activity reduced, falling by around 12% year on year between April and August, as many impending deals will have stalled or even stopped.
Within this reduction around half of all the deals that were completed in this period were sales of the Four Seasons brand from its administrators.
The largest purchasers included Roseberry Care Centres, whose 13 purchases has increased their portfolio to 29 locations, predominantly in the North of England. Their purchases were from small groups, mostly in administration.
Barchester Healthcare Group added eleven homes to their group through the purchase of Four Seasons locations through their Barchester Hellens company.
Barchester also added four new homes through openings, and so are by a length the most progressive care group during this period.
Marton Care added ten homes through procurement, nine of which were from Four Seasons, which brought their total portfolio up to 14 homes. Marton Care are connected to the Burlington Care Group who have a further 17 homes.
Richard Hoggart, Owner and CEO at Burlington Care and Marton Care Homes said about the purchases, “the staff teams, residents and families have been so welcoming with us as we acquired these Marton homes. We have ensured the staff teams remained employed and already commenced our upgrades and investments.”
Conclusion
It is obviously an insensitive thing to say but it seems that COVID-19 has come at the wrong time for the care home market.It is difficult to know if without the pandemic the Government would have been true to its word to “fix social care”. BREXIT is raising its head again and there always seems to be something that diverts attention from social care reforms.
Once again, this editorial is being updated as it is being written, as Matt Hancock, Secretary of State for Health and Social Care has said that whilst work had started on Social Care Reform, he would not give any idea as to when it would be delivered.
In the conclusion of the newly published report Beyond COVID: New thinking on the future of adult social care, the Social Care Institute for Excellence (SCIE) say “Now is the time for bold action to transform social care for decades to come. After nearly 20 years of underfunding it is time to call time on austerity. The adult social care system needs a long-term funding settlement; one that is simpler, fairer and helps tackle the fundamental inequalities which exist in society.”
So what are my thoughts on what will happen post COVID-19, whenever that is as far as safe access to care homes is concerned?
Care home closures will increase drastically, the level of increase dependent on whether a further tranche of extra financial support is provided through local authorities. Additionally many owners may well say enough is enough.
New care homes will stay low until an acceptable Social Care Reform plan is delivered although new care developments will continue on the basis that investment in other industries such as hospitality and retail is even more risky.
Investment in existing care homes, that are fit for purpose in the mid to long term, will increase as investors see bargains ahead. This will either be from existing providers to add to their portfolios, or external investors who will want locations with a track records and an existing occupancy, however low, which will increase the market for the companies who manage for investors.
Back To Top
Shutting The Care Home Door After The CQC Has Bolted - October Update

Ok, I am going to get personal for a while. My mother has been very comfortable in her care home for a couple of years now. My wife and I, mum's grandchildren, and great grandchildren would visit her regularly making her happy. My wife and I last saw her in April, on a bright sunny day in the home’s lovely large garden. We were the only ones in the garden, nicely socially distanced.
She has had no visits since then and now in October, I delivered some latest photos and a plant, leaving it at the care home door and thinking sadly, “I am only a few yards away from my mother, but cannot get to see her, or for her to see me.”
Now I am not going to cover this heart breaking subject in this investigation but feel astounded that untested CQC care inspectors can gain entry to that same home, to any home.
One month ago my first editorial on this subject included a statement from the CQC that "requesting a negative COVID-19 test before an inspection… could “restrict how our (CQC) inspectors do their job and could cause risk to people using the service” and “Attempts to prevent or limit our ability to fulfil our statutory responsibilities are unacceptable.”
In Shutting the Care Home Door 1, I reported that there were around 60 CQC inspections undertaken between the ends of June and July and published in August. That is 60 care homes for older people and up to 2,300 residents and the same number of care staff being put at risk, purely for the CQC to fulfil their “statutory responsibilities” even though the rest of us are living, working and behaving under strict guidelines or even laws.
And that is evidently, worryingly, unbelievably, still the case.
And to make it worse without the guarantee of inspectors being tested, there were twice as many inspections that took place in July and August, published in September!
Pre-COVID-19 there were on average around 350 inspections every month, and so this means the CQC were undertaking over one third of its normal capacity.
The latest figures show 122 care homes, with up to 6,000 residents, had an inspection between the ends of July and August and published in September.
Were these to protect our loved ones by inspecting homes that were Inadequate?
No, only a quarter of these were to Inadequate homes, and nearly half of them improved their ratings to Requires Improvement, one even became Good. Not bad considering that in addition to trying to meet the CQC’s self-defined standards, these homes were also battling things such as COVID-19 testing, PPE, families protesting their inability to visit their loved ones and much more.
I say well done to them.
So this means that around 75% of homes that were inspected during this period were either Good or Requires Improvement, and this grew to 78% with the new ratings. Again well done to them.
We are all hoping that the restrictions under which we are living, some in greater levels of lockdown than others, will disappear as the real risk of COVID-19 does likewise, and that the period between then and now is as short as it can be. I like hundreds of thousands of people want to see their loved ones.
CQC, if you insist on undertaking further inspections, and I imagine you will have done many more in September that we have still to see, get your inspectors tested first. Play the same game as we are being asked to, you are not a special case.
8th October 2020
Back To Top
Shutting The Care Home Door After The CQC Has Bolted
There is currently a lot of lobbying currently being undertaken by the likes of care associations such as the National Care Forum who at the end of August wrote an open letter to Matt Hancock, Secretary of State for Health and Social Care, and Helen Whately, Minister for Care, calling for a reversal of the decision to allow CQC inspectors into care homes without testing.
In a CQC September COVID-19 Update Kate Terroni, Chief lnspector of Adult Social Care says that provider requests such as:
How risking employees’ and residents’ life is less important than allowing CQC inspectors to do their job, or hinder the CQC's statutory responsibilities, escapes me. However, the CQC has already been into care homes carrying out inspections in recent months.
Their latest care register shows this. During the June to August period there are 104 published inspections listed. Now I know, much to the annoyance of care homes with an improved rating from their latest inspection, there is quite a sizeable time lapse between the actual inspection and its publication, so I have drilled down further to establish which inspections were undertaken during this period.
There were around 60 CQC inspections undertaken between the ends of June and July and published in August.
On average there are around 350 care home inspections every month, so this is only about one sixth of the norm, but why risk lives to undertake these inspections?
The Government promised regular testing in care homes from 6th July, but of the course in early August they put this back to September, and as of today it is still not properly in place. So that means during the July inspections it was not known if any care home employees, residents and CQC inspectors were COVID-19 positive.
Was it a unitary decision by a single CQC region to restart inspections? Not all 9 regions undertook inspections.
And from a Care Quality from a point of view, whilst most of a sample of reports I read said that the inspection took place “to check whether improvements had been made”, but two thirds of homes inspected did so with either a Good or Requires Improvement rating at the time of inspection.
Only a third were Inadequate – and therefore maybe of concern with regard to the “safety” of residents – but what sort of added risk to life did the inspections place on all these homes.
And from the subsequent inspections, the two thirds Good or Requires Improvement ratings became three quarters, so in general performance within these homes had improved, despite them all having to deal with the chaos and stress of life within a care home since April.
It will be interesting to see how many inspections took place in August. Watch this space.
It is imperative that the Government and CQC will concede that the regular testing of inspectors will take place before inspections take place, and also testing within homes will be sorted, and any homes identified with any positive COVID-19 tests are not inspected.
9th September 2020
In a CQC September COVID-19 Update Kate Terroni, Chief lnspector of Adult Social Care says that provider requests such as:
- requesting all inspections to be announced
- limiting the number of inspectors on site
- restricting the use of toilet and hand washing facilities
- requesting a negative COVID-19 test before an inspection
How risking employees’ and residents’ life is less important than allowing CQC inspectors to do their job, or hinder the CQC's statutory responsibilities, escapes me. However, the CQC has already been into care homes carrying out inspections in recent months.
Their latest care register shows this. During the June to August period there are 104 published inspections listed. Now I know, much to the annoyance of care homes with an improved rating from their latest inspection, there is quite a sizeable time lapse between the actual inspection and its publication, so I have drilled down further to establish which inspections were undertaken during this period.
There were around 60 CQC inspections undertaken between the ends of June and July and published in August.
On average there are around 350 care home inspections every month, so this is only about one sixth of the norm, but why risk lives to undertake these inspections?
The Government promised regular testing in care homes from 6th July, but of the course in early August they put this back to September, and as of today it is still not properly in place. So that means during the July inspections it was not known if any care home employees, residents and CQC inspectors were COVID-19 positive.
Was it a unitary decision by a single CQC region to restart inspections? Not all 9 regions undertook inspections.
And from a Care Quality from a point of view, whilst most of a sample of reports I read said that the inspection took place “to check whether improvements had been made”, but two thirds of homes inspected did so with either a Good or Requires Improvement rating at the time of inspection.
Only a third were Inadequate – and therefore maybe of concern with regard to the “safety” of residents – but what sort of added risk to life did the inspections place on all these homes.
And from the subsequent inspections, the two thirds Good or Requires Improvement ratings became three quarters, so in general performance within these homes had improved, despite them all having to deal with the chaos and stress of life within a care home since April.
It will be interesting to see how many inspections took place in August. Watch this space.
It is imperative that the Government and CQC will concede that the regular testing of inspectors will take place before inspections take place, and also testing within homes will be sorted, and any homes identified with any positive COVID-19 tests are not inspected.
9th September 2020
Back To Top
The following is a reproduction from the Care Management Matters Magazine December 2019
Between January 2015 and the end of September 2019, 602 care homes have opened, but during that same period 1,221 have closed. The closures have accounted for nearly 38,000 beds lost – that is around 10% of the total number of beds currently available.
Assuming these homes had an average 75% occupancy level, this would mean that around 28,000 vulnerable older people will have had to find new accommodation over the last five years.
One very slight consolation is that over 600 homes have opened in this time and they are, on average, larger than those that have closed, meaning that 28,750 new beds have been generated. However, this still shows a net loss of around 8,900 beds, while the population of people aged over 75 in England has grown by half a million – or 11% – during that period.
The 1,221 homes that have closed since 2015 are actual closures and not what CQC would refer to as ‘De-Activations’, which total over 3,300 since the beginning of 2015. The 2,000 or so that bring us up to this figure entail change of ownership or legal entity.
It is interesting to see that not all closures were lost forever, and a few subsequently reopened under new ownership at a later date. Seven homes re-opened within a year, 13 reopened within one and two years, and two reopened three and four years after closure respectively. But 20 homes that opened since the start of 2015 have since closed.
The Office for National Statistics recently reported that the number of people aged 85 and over, who account for about half all care home beds, will double in 25 years’ time. This doubling in numbers has been forecast since I started reporting, so it is not exactly breaking news, but we still aren’t seeing much of an increase in the number of beds overall. Something needs to be done to turn this trend around and make sure supply matches demand in the coming years.
Way back in 2002, the Personal Social Services Research Unit (PSSRU) published a report, Care Home Closures: The Provider Perspective and their headline reason for the 20 closures they studied was, ‘All but one of the homes (which was closed due to enforcement action) closed either to avoid further losses, or due to the business earning an inadequate return now or in the future.’
This will still undoubtedly be the case, although with the CQC rating system in place it is now more than one in three that has closed with an Inadequate rating, not the one in 20 homes that ‘closed due to enforcement action’.
Out of the 1,221 homes that have closed since 2015, 338 did so without being inspected under the CQC ratings system that was introduced in October 2014. Of these, only 42 were closed after March 2016 when the CQC had planned to have all services inspected (a target that it missed).
Of those who closed having had an inspection, around two thirds were ‘non-compliant’ – 37% were rated Inadequate and 29% Requires Improvement.
It is perhaps easy to understand why the Inadequate homes closed but there are currently nearly 2,000 homes trading with a Requires Improvement rating. Are some of these also likely to close as their occupancy and income suffers because prospective residents opt for their competitor homes with Good ratings?
If two thirds of closures since 2015 were non-compliant, this also means that one third of homes that closed were rated Good (two homes were in fact rated Outstanding), so we must assume commercial pressures as the reason for closure.
At CSI, we base estimated supply levels on the number of beds per thousand people aged 75 and over in the area. This age group, according to 2011 research by Bupa and PSSRU, accounts for 90% of all care home beds. Looking at this data, we can see that half of the Good homes that have closed since 2015 were located in local authorities with higher than average supply levels.
We can assume that those homes in areas with high levels of supply and increased competition would have probably suffered with lower than average occupancy levels. Another problem with too many care homes in one area is likely to be the ability to recruit and retain care management and staff.
Of the closures, half of those that were rated Good had 25 beds or less, and so the economies of scale may have played a part in the closure, where a change of use for the location was a better financial option for the provider.
It is certainly not a case of boom in the ‘affluent south’ and bust everywhere north. Across the 150 local authorities in England, only 40 have gained beds, and 15 broken even, since 2015. Most regions have lost beds overall. The biggest losers since 2015 have been London, the North East and the South West with net losses of up to 6% of beds. Yorkshire and The Humber fared slightly better with a net loss of around 3% of their beds, and the East Midlands, North West and South East had net losses of between 1% and 2%.
Only two regions, the East of England and the West Midlands, have added to their number of beds, but only nominally at less than half a percent.
When we look at the national average of a third of homes closing with a Good CQC rating, we can see that there have been higher levels of closures in this group in the East Midlands and the North East, both around 42%. However, with a potentially interesting East/West split, this figure stands at around 25% in the West Midlands and the North West.
It goes without saying that local authority contributions are lower than they should be across the board, but there was little difference in fee levels paid by the local authorities that gained beds compared to those that lost them.
According to the Improved Better Care Fund (iBCF): Provider fee reporting Quarter 2 2018-19, the eight local authorities that have grown their number of beds by 10% or more were paying, on average, £696 a week for a care home with nursing bed and £649 a care home bed.
At the other end of the scale, 36 local authorities have had a greater than 10% net loss in beds over the last five years, and the average weekly contributions from these local authorities were £665 and £625 respectively, so around 4% lower than the best performing authorities.
Something perhaps unexpected is that it seems as though if your care home does not offer dementia care, you have greater chance of closure.
Whilst locations that are not providing dementia care (i.e. those homes that have not ticked Service user band – Dementia on their CQC registration) account for around 30% of all care homes, they accounted for 46% of all closures. Since 2015, there have been 660 closures of care homes not offering dementia care compared to only 200 openings, indicating a declining sector.
On the other side of this, with openings matching closures at around 220, the nursing dementia sector has in fact grown by around 3,750 beds, but the residential dementia sector has seen just 180 openings and as many as 438 closures, losing around 4,660 beds since 2015.
This increase in beds in nursing dementia care means that care homes with nursing overall have lost just a few hundred beds in the last five years, while the residential sector has lost heavily.
Looking at the size of a provider has also uncovered some interesting trends. Larger providers, with 10 or more care homes, make up around 30% of all homes, and 40% of all beds. They also account for 28% of openings and only 20% of closures but have still lost around 1,000 beds overall.
Out of the 950 different large providers that have closed at least one home in the last five years, 759 no longer appear on the CQC register at all.
Survival of the fittest is a factor in all aspects of life and business, and there is no doubt that closures will include converted properties that were, or were becoming, unfit for purpose and are being replaced (but not in the same local area) with shiny new purpose-built units. And 8,272 beds were lost in care homes that were rated Good, which is almost as much as the 8,900 beds that were lost overall. This should not be happening.
Care home closures can shatter lives; the owners, their employees, residents and their families, and of course those people struggling to find a bed when local homes close down. Local authorities need to take control of what is going on in their domain, with social services working alongside planners to ensure that planning consent is not given where there is already an oversupply of beds, and that applications are fast-tracked where there is a proven need.
Between January 2015 and the end of September 2019, 602 care homes have opened, but during that same period 1,221 have closed. The closures have accounted for nearly 38,000 beds lost – that is around 10% of the total number of beds currently available.
Assuming these homes had an average 75% occupancy level, this would mean that around 28,000 vulnerable older people will have had to find new accommodation over the last five years.
One very slight consolation is that over 600 homes have opened in this time and they are, on average, larger than those that have closed, meaning that 28,750 new beds have been generated. However, this still shows a net loss of around 8,900 beds, while the population of people aged over 75 in England has grown by half a million – or 11% – during that period.
The 1,221 homes that have closed since 2015 are actual closures and not what CQC would refer to as ‘De-Activations’, which total over 3,300 since the beginning of 2015. The 2,000 or so that bring us up to this figure entail change of ownership or legal entity.
It is interesting to see that not all closures were lost forever, and a few subsequently reopened under new ownership at a later date. Seven homes re-opened within a year, 13 reopened within one and two years, and two reopened three and four years after closure respectively. But 20 homes that opened since the start of 2015 have since closed.
The Office for National Statistics recently reported that the number of people aged 85 and over, who account for about half all care home beds, will double in 25 years’ time. This doubling in numbers has been forecast since I started reporting, so it is not exactly breaking news, but we still aren’t seeing much of an increase in the number of beds overall. Something needs to be done to turn this trend around and make sure supply matches demand in the coming years.
The where and why
Way back in 2002, the Personal Social Services Research Unit (PSSRU) published a report, Care Home Closures: The Provider Perspective and their headline reason for the 20 closures they studied was, ‘All but one of the homes (which was closed due to enforcement action) closed either to avoid further losses, or due to the business earning an inadequate return now or in the future.’
This will still undoubtedly be the case, although with the CQC rating system in place it is now more than one in three that has closed with an Inadequate rating, not the one in 20 homes that ‘closed due to enforcement action’.
Out of the 1,221 homes that have closed since 2015, 338 did so without being inspected under the CQC ratings system that was introduced in October 2014. Of these, only 42 were closed after March 2016 when the CQC had planned to have all services inspected (a target that it missed).
Of those who closed having had an inspection, around two thirds were ‘non-compliant’ – 37% were rated Inadequate and 29% Requires Improvement.
It is perhaps easy to understand why the Inadequate homes closed but there are currently nearly 2,000 homes trading with a Requires Improvement rating. Are some of these also likely to close as their occupancy and income suffers because prospective residents opt for their competitor homes with Good ratings?
If two thirds of closures since 2015 were non-compliant, this also means that one third of homes that closed were rated Good (two homes were in fact rated Outstanding), so we must assume commercial pressures as the reason for closure.
At CSI, we base estimated supply levels on the number of beds per thousand people aged 75 and over in the area. This age group, according to 2011 research by Bupa and PSSRU, accounts for 90% of all care home beds. Looking at this data, we can see that half of the Good homes that have closed since 2015 were located in local authorities with higher than average supply levels.
We can assume that those homes in areas with high levels of supply and increased competition would have probably suffered with lower than average occupancy levels. Another problem with too many care homes in one area is likely to be the ability to recruit and retain care management and staff.
Of the closures, half of those that were rated Good had 25 beds or less, and so the economies of scale may have played a part in the closure, where a change of use for the location was a better financial option for the provider.
Regional variations
It is certainly not a case of boom in the ‘affluent south’ and bust everywhere north. Across the 150 local authorities in England, only 40 have gained beds, and 15 broken even, since 2015. Most regions have lost beds overall. The biggest losers since 2015 have been London, the North East and the South West with net losses of up to 6% of beds. Yorkshire and The Humber fared slightly better with a net loss of around 3% of their beds, and the East Midlands, North West and South East had net losses of between 1% and 2%.
Only two regions, the East of England and the West Midlands, have added to their number of beds, but only nominally at less than half a percent.
When we look at the national average of a third of homes closing with a Good CQC rating, we can see that there have been higher levels of closures in this group in the East Midlands and the North East, both around 42%. However, with a potentially interesting East/West split, this figure stands at around 25% in the West Midlands and the North West.
It goes without saying that local authority contributions are lower than they should be across the board, but there was little difference in fee levels paid by the local authorities that gained beds compared to those that lost them.
According to the Improved Better Care Fund (iBCF): Provider fee reporting Quarter 2 2018-19, the eight local authorities that have grown their number of beds by 10% or more were paying, on average, £696 a week for a care home with nursing bed and £649 a care home bed.
At the other end of the scale, 36 local authorities have had a greater than 10% net loss in beds over the last five years, and the average weekly contributions from these local authorities were £665 and £625 respectively, so around 4% lower than the best performing authorities.
A shift in trends
Something perhaps unexpected is that it seems as though if your care home does not offer dementia care, you have greater chance of closure.
Whilst locations that are not providing dementia care (i.e. those homes that have not ticked Service user band – Dementia on their CQC registration) account for around 30% of all care homes, they accounted for 46% of all closures. Since 2015, there have been 660 closures of care homes not offering dementia care compared to only 200 openings, indicating a declining sector.
On the other side of this, with openings matching closures at around 220, the nursing dementia sector has in fact grown by around 3,750 beds, but the residential dementia sector has seen just 180 openings and as many as 438 closures, losing around 4,660 beds since 2015.
This increase in beds in nursing dementia care means that care homes with nursing overall have lost just a few hundred beds in the last five years, while the residential sector has lost heavily.
Looking at the size of a provider has also uncovered some interesting trends. Larger providers, with 10 or more care homes, make up around 30% of all homes, and 40% of all beds. They also account for 28% of openings and only 20% of closures but have still lost around 1,000 beds overall.
Out of the 950 different large providers that have closed at least one home in the last five years, 759 no longer appear on the CQC register at all.
Taking control
Survival of the fittest is a factor in all aspects of life and business, and there is no doubt that closures will include converted properties that were, or were becoming, unfit for purpose and are being replaced (but not in the same local area) with shiny new purpose-built units. And 8,272 beds were lost in care homes that were rated Good, which is almost as much as the 8,900 beds that were lost overall. This should not be happening.
Care home closures can shatter lives; the owners, their employees, residents and their families, and of course those people struggling to find a bed when local homes close down. Local authorities need to take control of what is going on in their domain, with social services working alongside planners to ensure that planning consent is not given where there is already an oversupply of beds, and that applications are fast-tracked where there is a proven need.
Back To Top